

signal strength 4 of 5

The Triple Top pattern has formed on the chart of the EURJPY H1. Features of the pattern: borders have an ascending angle; the lower line of the pattern has the coordinates 161.49/162.07 with the upper limit 163.10/163.14; the projection of the width is 161 points. The formation of the Triple Top figure most likely indicates a change in the trend from upward to downward. This means that in the event of a breakdown of the support level of 161.49, the price is most likely to continue the downward movement.
Xem thêm
- All
- Double Top
- Flag
- Head and Shoulders
- Pennant
- Rectangle
- Triangle
- Triple top
- All
- #AAPL
- #AMZN
- #Bitcoin
- #EBAY
- #FB
- #GOOG
- #INTC
- #KO
- #MA
- #MCD
- #MSFT
- #NTDOY
- #PEP
- #TSLA
- #TWTR
- AUDCAD
- AUDCHF
- AUDJPY
- AUDUSD
- EURCAD
- EURCHF
- EURGBP
- EURJPY
- EURNZD
- EURRUB
- EURUSD
- GBPAUD
- GBPCHF
- GBPJPY
- GBPUSD
- GOLD
- NZDCAD
- NZDCHF
- NZDJPY
- NZDUSD
- SILVER
- USDCAD
- USDCHF
- USDJPY
- USDRUB
- All
- M5
- M15
- M30
- H1
- D1
- All
- Buy
- Sale
- All
- 1
- 2
- 3
- 4
- 5
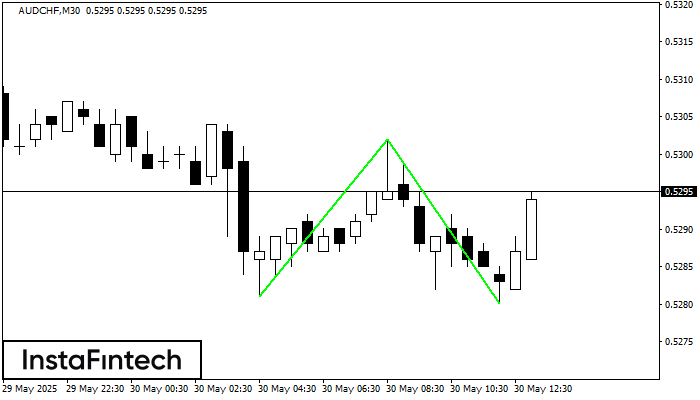
Mô hình Đáy đôi đã được hình thành trên AUDCHF M30. Đặc điểm: mức hỗ trợ 0.5281; mức kháng cự 0.5302; chiều rộng của mô hình 21 điểm
Open chart in a new window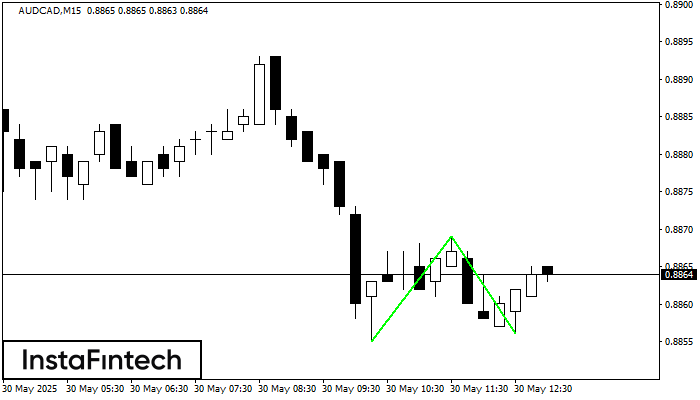
Mô hình Đáy đôi đã được hình thành trên AUDCAD M15; đường viền trên là 0.8869; đường viền dưới là 0.8856. Độ rộng của mô hình là 14 điểm. Trong
Khung thời gian M5 và M15 có thể có nhiều điểm vào lệnh sai hơn.
Open chart in a new window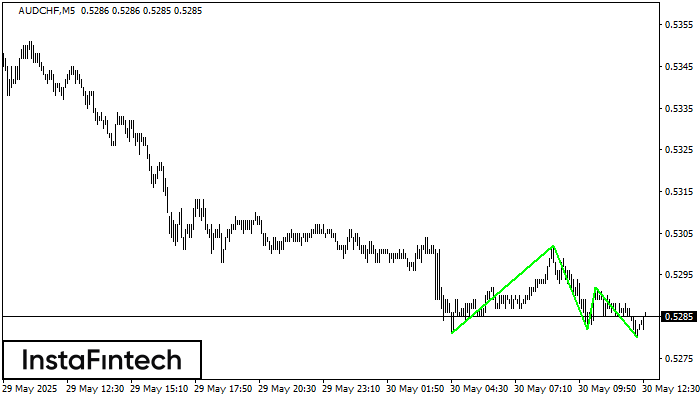
Mô hình Đáy ba đã được hình thành trên biểu đồ của AUDCHF M5. Các tính năng của mô hình: Đường dưới của mô hình có tọa độ 0.5302
Khung thời gian M5 và M15 có thể có nhiều điểm vào lệnh sai hơn.
Open chart in a new window


