


signal strength 2 of 5

The #Bitcoin M15 formed the Head and Shoulders pattern with the following features: The Head’s top is at 88742.88, the Neckline and the upward angle are at 87100.22/87010.53. The formation of this pattern can bring about changes in the current trend from bullish to bearish. In case the pattern triggers the expected changes, the price of #Bitcoin will go towards 87010.30.
The M5 and M15 time frames may have more false entry points.
- All
- Double Top
- Flag
- Head and Shoulders
- Pennant
- Rectangle
- Triangle
- Triple top
- All
- #AAPL
- #AMZN
- #Bitcoin
- #EBAY
- #FB
- #GOOG
- #INTC
- #KO
- #MA
- #MCD
- #MSFT
- #NTDOY
- #PEP
- #TSLA
- #TWTR
- AUDCAD
- AUDCHF
- AUDJPY
- AUDUSD
- EURCAD
- EURCHF
- EURGBP
- EURJPY
- EURNZD
- EURRUB
- EURUSD
- GBPAUD
- GBPCHF
- GBPJPY
- GBPUSD
- GOLD
- NZDCAD
- NZDCHF
- NZDJPY
- NZDUSD
- SILVER
- USDCAD
- USDCHF
- USDJPY
- USDRUB
- All
- M5
- M15
- M30
- H1
- D1
- All
- Buy
- Sale
- All
- 1
- 2
- 3
- 4
- 5
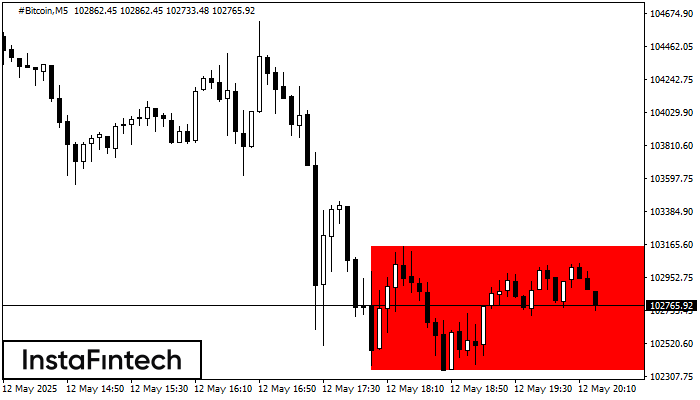
Сформирована фигура «Прямоугольник» на графике #Bitcoin M5. Тип фигуры: Продолжение тренда; Границы: Верхняя 103156.34, Нижняя 102345.35; Сигнал: позиция на продажу открывается после фиксации цены ниже границы прямоугольника 102345.35
Таймфреймы М5 и М15 могут иметь больше ложных точек входа.
Открыть график инструмента в новом окне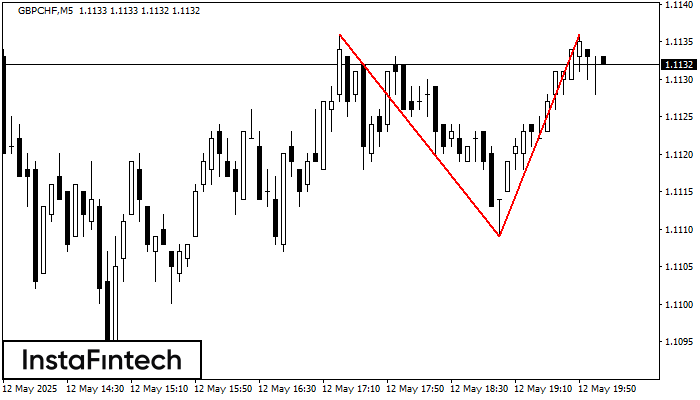
На торговом графике GBPCHF M5 сформировалась разворотная фигура «Двойная вершина». Характеристика: Верхняя граница 1.1136; Нижняя граница 1.1109; Ширина фигуры 27 пунктов. Сигнал: Пробой нижней границы 1.1109 приведет к дальнейшему нисходящему
Таймфреймы М5 и М15 могут иметь больше ложных точек входа.
Открыть график инструмента в новом окне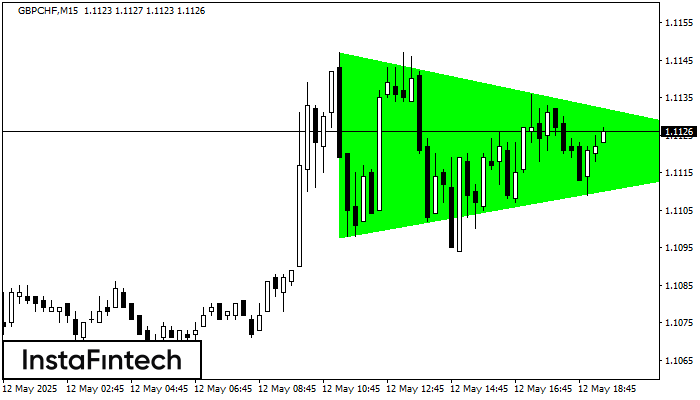
По GBPCHF на M15 сформировалась фигура «Бычий симметричный треугольник», которая сигнализирует нам о продолжении тенденции. Характеристика: Верхняя граница фигуры имеет координаты 1.1147/1.1120; Нижняя граница 1.1098/1.1120; Проекция ширины фигуры 49 пунктов
Таймфреймы М5 и М15 могут иметь больше ложных точек входа.
Открыть график инструмента в новом окне


