

сила сигнала 4 из 5
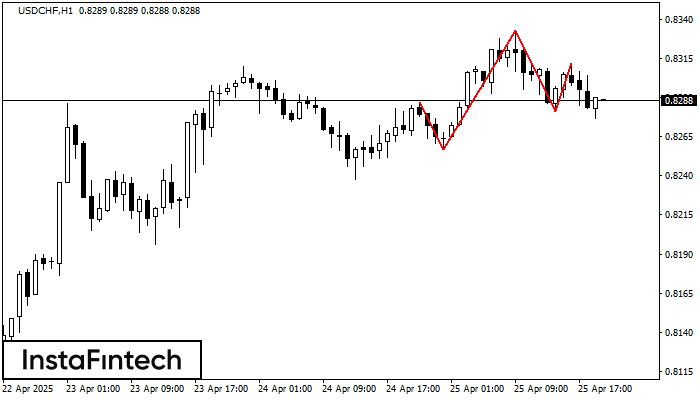
По USDCHF на H1 сформировалась фигура «Голова и плечи». Вершина головы закреплена на 0.8333, при этом средняя линия шеи расположена на 0.8257/0.8281. Формирование фигуры «Голова и плечи» наиболее вероятным образом свидетельствует о развороте восходящего тренда. Это означает, что курс USDCHF, в случае срабатывания фигуры, пойдет в направлении 0.8241 (30 - 50 пипсов).
- Все
- Вымпел
- Голова и плечи
- Двойная вершина
- Прямоугольник
- Треугольник
- Тройная вершина
- Флаг
- Все
- #AAPL
- #AMZN
- #Bitcoin
- #EBAY
- #FB
- #GOOG
- #INTC
- #KO
- #MA
- #MCD
- #MSFT
- #NTDOY
- #PEP
- #TSLA
- #TWTR
- AUDCAD
- AUDCHF
- AUDJPY
- AUDUSD
- EURCAD
- EURCHF
- EURGBP
- EURJPY
- EURNZD
- EURRUB
- EURUSD
- GBPAUD
- GBPCHF
- GBPJPY
- GBPUSD
- GOLD
- NZDCAD
- NZDCHF
- NZDJPY
- NZDUSD
- SILVER
- USDCAD
- USDCHF
- USDJPY
- USDRUB
- Все
- M5
- M15
- M30
- H1
- D1
- Все
- Покупка
- Продажа
- Все
- 1
- 2
- 3
- 4
- 5
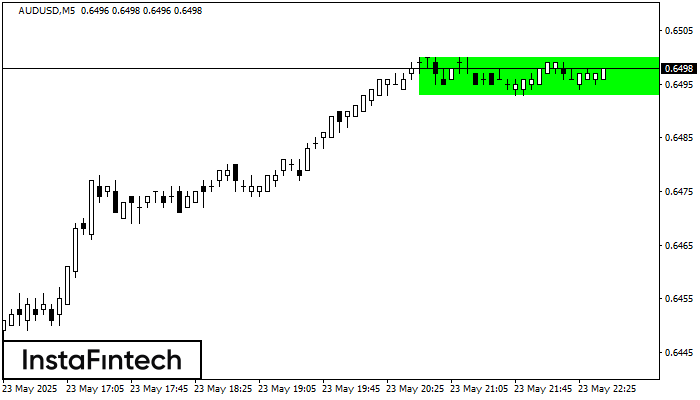
According to the chart of M5, AUDUSD formed the Bullish Rectangle. The pattern indicates a trend continuation. The upper border is 0.6500, the lower border is 0.6493. The signal means
The M5 and M15 time frames may have more false entry points.
Открыть график инструмента в новом окне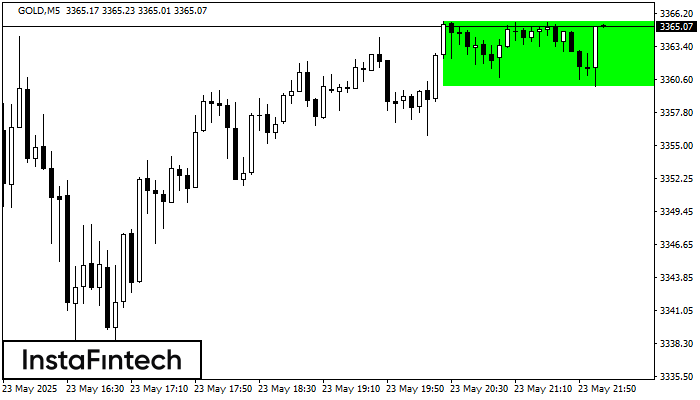
According to the chart of M5, GOLD formed the Bullish Rectangle which is a pattern of a trend continuation. The pattern is contained within the following borders: the lower border
The M5 and M15 time frames may have more false entry points.
Открыть график инструмента в новом окне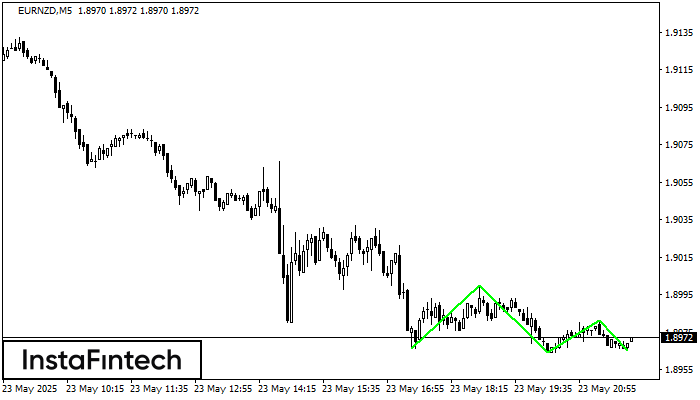
The Triple Bottom pattern has formed on the chart of EURNZD M5. Features of the pattern: The lower line of the pattern has coordinates 1.9000 with the upper limit 1.9000/1.8981
The M5 and M15 time frames may have more false entry points.
Открыть график инструмента в новом окне


