


сила сигнала 1 из 5
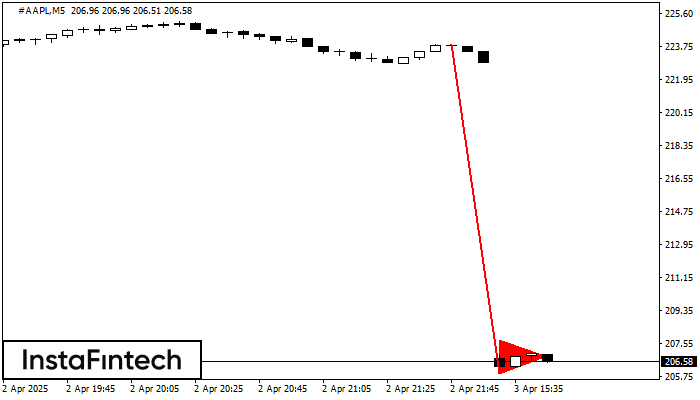
На графике #AAPL M5 сформировалась фигура «Медвежий вымпел», которая сигнализирует о возможном продолжении тренда. Характеристика: основание фигуры имеет координаты 205.88; проекция высоты флагштока равна 1802 пунктов. В случае если цена преодолеет основание фигуры 205.88, то ожидается продолжение нисходящего тренда на уровень 205.74 пунктов.
Таймфреймы М5 и М15 могут иметь больше ложных точек входа.
Дивіться також
- Все
- Вымпел
- Голова и плечи
- Двойная вершина
- Прямоугольник
- Треугольник
- Тройная вершина
- Флаг
- Все
- #AAPL
- #AMZN
- #Bitcoin
- #EBAY
- #FB
- #GOOG
- #INTC
- #KO
- #MA
- #MCD
- #MSFT
- #NTDOY
- #PEP
- #TSLA
- #TWTR
- AUDCAD
- AUDCHF
- AUDJPY
- AUDUSD
- EURCAD
- EURCHF
- EURGBP
- EURJPY
- EURNZD
- EURRUB
- EURUSD
- GBPAUD
- GBPCHF
- GBPJPY
- GBPUSD
- GOLD
- NZDCAD
- NZDCHF
- NZDJPY
- NZDUSD
- SILVER
- USDCAD
- USDCHF
- USDJPY
- USDRUB
- Все
- M5
- M15
- M30
- H1
- D1
- Все
- Покупка
- Продажа
- Все
- 1
- 2
- 3
- 4
- 5

According to the chart of M5, GOLD formed the Bearish Symmetrical Triangle pattern. Description: The lower border is 3314.14/3331.45 and upper border is 3343.45/3331.45. The pattern width is measured
The M5 and M15 time frames may have more false entry points.
Open chart in a new window
The Triple Bottom pattern has formed on the chart of EURUSD H1. Features of the pattern: The lower line of the pattern has coordinates 1.1439 with the upper limit 1.1439/1.1357
Open chart in a new window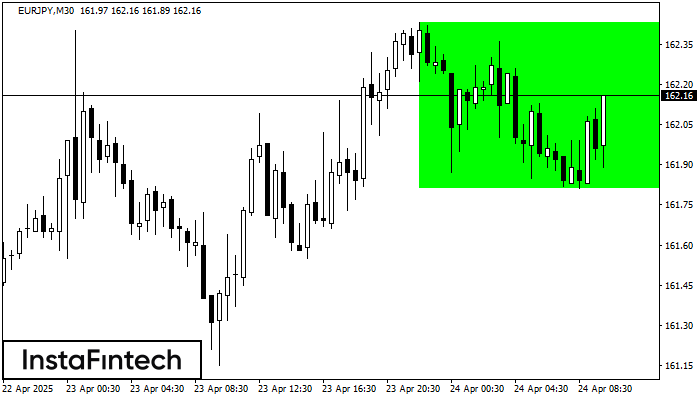
According to the chart of M30, EURJPY formed the Bullish Rectangle. The pattern indicates a trend continuation. The upper border is 162.43, the lower border is 161.81. The signal means
Open chart in a new window


