

signal strength 1 of 5
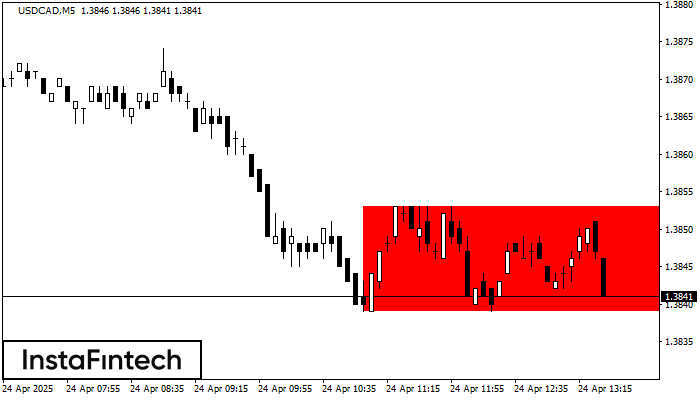
According to the chart of M5, USDCAD formed the Bearish Rectangle which is a pattern of a trend continuation. The pattern is contained within the following borders: lower border 1.3839 – 1.3839 and upper border 1.3853 – 1.3853. In case the lower border is broken, the instrument is likely to follow the downward trend.
The M5 and M15 time frames may have more false entry points.
- All
- Double Top
- Flag
- Head and Shoulders
- Pennant
- Rectangle
- Triangle
- Triple top
- All
- #AAPL
- #AMZN
- #Bitcoin
- #EBAY
- #FB
- #GOOG
- #INTC
- #KO
- #MA
- #MCD
- #MSFT
- #NTDOY
- #PEP
- #TSLA
- #TWTR
- AUDCAD
- AUDCHF
- AUDJPY
- AUDUSD
- EURCAD
- EURCHF
- EURGBP
- EURJPY
- EURNZD
- EURRUB
- EURUSD
- GBPAUD
- GBPCHF
- GBPJPY
- GBPUSD
- GOLD
- NZDCAD
- NZDCHF
- NZDJPY
- NZDUSD
- SILVER
- USDCAD
- USDCHF
- USDJPY
- USDRUB
- All
- M5
- M15
- M30
- H1
- D1
- All
- Buy
- Sale
- All
- 1
- 2
- 3
- 4
- 5
was formed on 06.05 at 09:01:14 (UTC+0)
signal strength 4 of 5
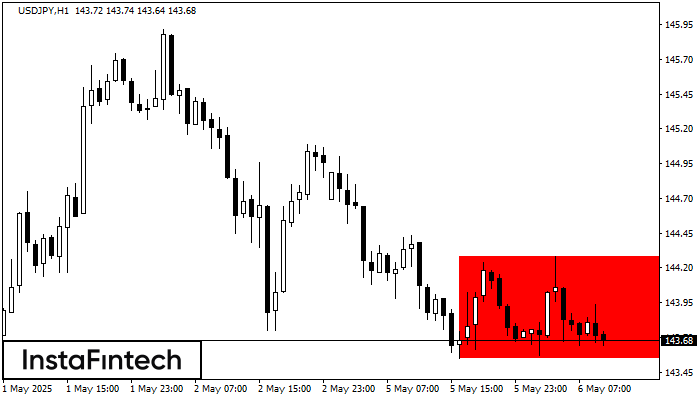
อ้างอิงจากชาร์ตของ H1, USDJPY ที่ได้สร้างรูปแบบ รูปแบบกราฟสี่เหลี่ยมผืนผ้าขาลง (Bearish Rectangle) ออกมา ซึ่งเป็นรูปแบบของ ความต่อเนื่องในแนวโน้ม รูปแบบนี้จะอยู่ภายในขอบเขตดังต่อไปนี้: ขอบเขตด้านล่าง 143.55 – 143.55
Open chart in a new windowwas formed on 06.05 at 08:45:22 (UTC+0)
signal strength 1 of 5
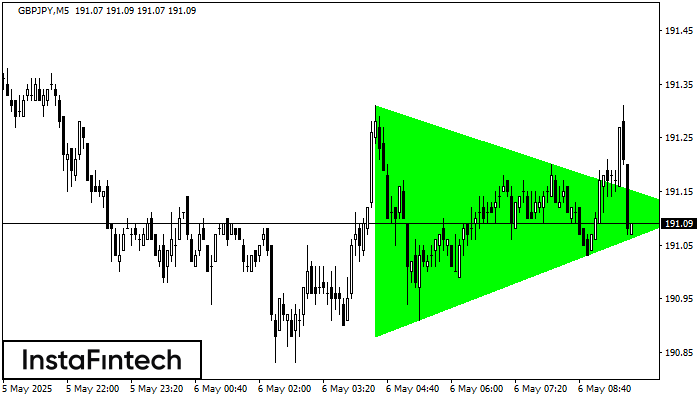
อ้างอิงจากชาร์ตของ M5, GBPJPY ที่ได้สร้างรูปแบบ รูปแบบสามเหลี่ยมสมมาตรขาขึ้น (Bullish Symmetrical Triangle) ออกมา ขอบเขตด้านล่างของรูปแบบสัมผัสพิกัด 190.88/191.11 แม้ว่าขอบเขตด้านบนจะข้ามผ่าน 191.31/191.11 ถ้ารูปแบบ รูปแบบสามเหลี่ยมสมมาตรขาขึ้น
ขอบเตระยะเวลาใน M5 และ M15 อาจจะมีตำแหน่งการเข้าใช้งานที่ผิดพลาดมากยิ่งขึ้น
Open chart in a new window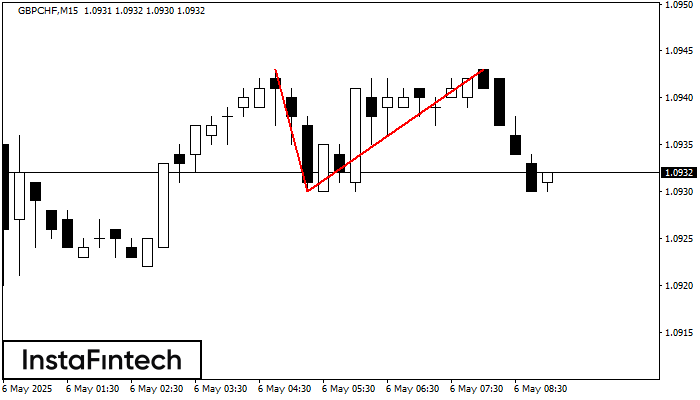
ในชาร์ตของ GBPCHF M15 พบว่า กราฟรูปแบบย้อนกลับ รูปแบบกราฟจุดสองยอด (Double Top) ได้ถูกสร้างขึ้นมา คุณลักษณะ: ขอบเขตด้านบน 1.0943; ขอบเขตด้านล่าง 1.0930; ความกว้างของกราฟรูปแบบนี้คือ
ขอบเตระยะเวลาใน M5 และ M15 อาจจะมีตำแหน่งการเข้าใช้งานที่ผิดพลาดมากยิ่งขึ้น
Open chart in a new window


