


signal strength 1 of 5
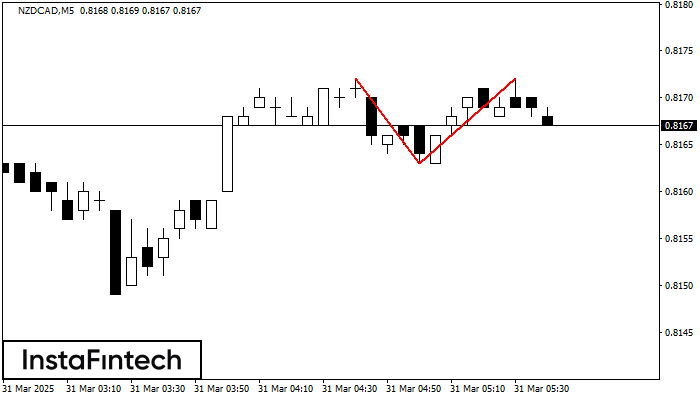
On the chart of NZDCAD M5 the Double Top reversal pattern has been formed. Characteristics: the upper boundary 0.8172; the lower boundary 0.8163; the width of the pattern 9 points. The signal: a break of the lower boundary will cause continuation of the downward trend targeting the 0.8148 level.
The M5 and M15 time frames may have more false entry points.
ดูเพิ่มเติม
- All
- Double Top
- Flag
- Head and Shoulders
- Pennant
- Rectangle
- Triangle
- Triple top
- All
- #AAPL
- #AMZN
- #Bitcoin
- #EBAY
- #FB
- #GOOG
- #INTC
- #KO
- #MA
- #MCD
- #MSFT
- #NTDOY
- #PEP
- #TSLA
- #TWTR
- AUDCAD
- AUDCHF
- AUDJPY
- AUDUSD
- EURCAD
- EURCHF
- EURGBP
- EURJPY
- EURNZD
- EURRUB
- EURUSD
- GBPAUD
- GBPCHF
- GBPJPY
- GBPUSD
- GOLD
- NZDCAD
- NZDCHF
- NZDJPY
- NZDUSD
- SILVER
- USDCAD
- USDCHF
- USDJPY
- USDRUB
- All
- M5
- M15
- M30
- H1
- D1
- All
- Buy
- Sale
- All
- 1
- 2
- 3
- 4
- 5
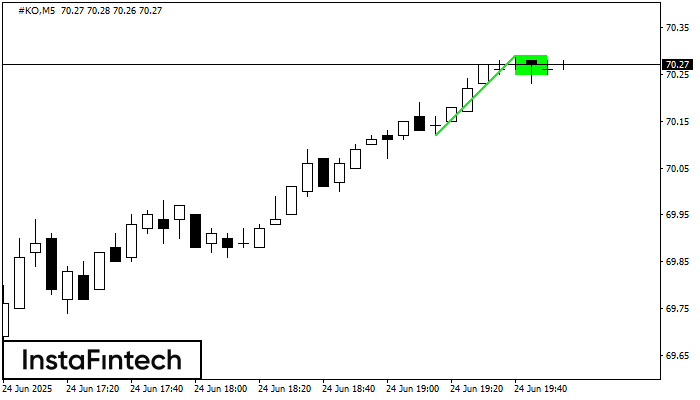
The Bullish Flag pattern has been formed on the chart #KO M5 which signals that the upward trend will continue. Signals: а break of the peak at 70.29 may push
The M5 and M15 time frames may have more false entry points.
Open chart in a new window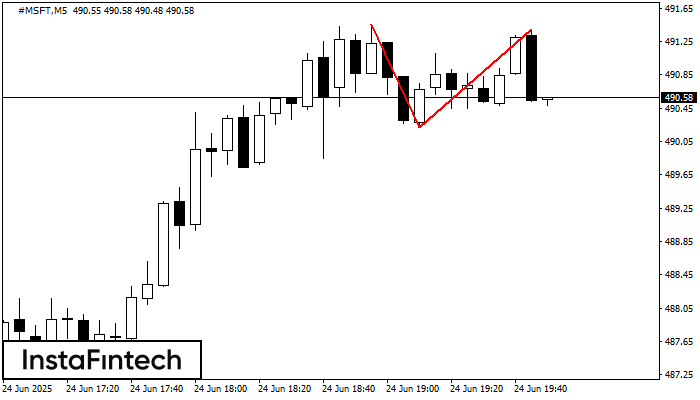
The Double Top reversal pattern has been formed on #MSFT M5. Characteristics: the upper boundary 491.46; the lower boundary 490.22; the width of the pattern is 118 points. Sell trades
The M5 and M15 time frames may have more false entry points.
Open chart in a new window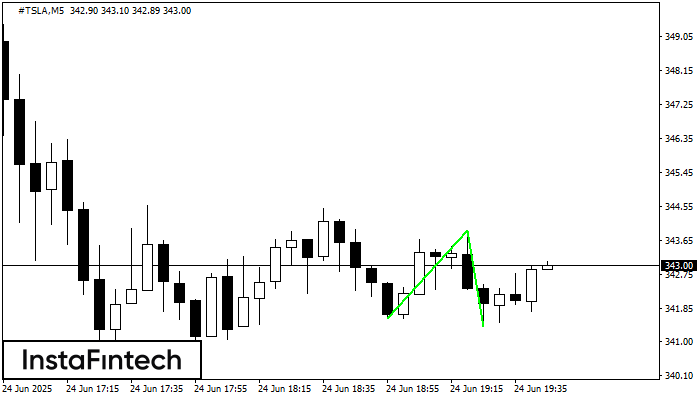
The Double Bottom pattern has been formed on #TSLA M5; the upper boundary is 343.92; the lower boundary is 341.39. The width of the pattern is 233 points. In case
The M5 and M15 time frames may have more false entry points.
Open chart in a new window


