

signal strength 2 of 5
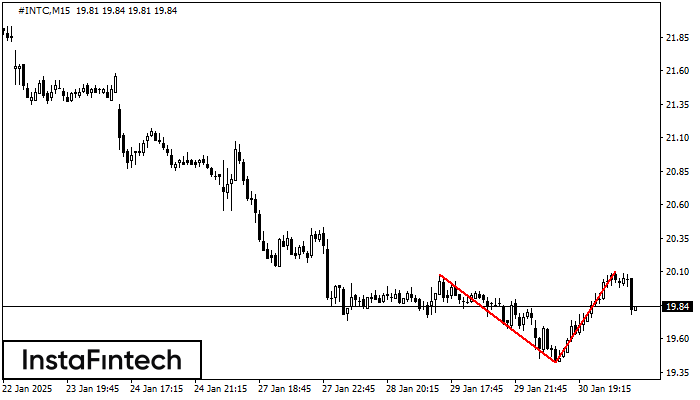
The Double Top pattern has been formed on #INTC M15. It signals that the trend has been changed from upwards to downwards. Probably, if the base of the pattern 19.42 is broken, the downward movement will continue.
The M5 and M15 time frames may have more false entry points.
ดูเพิ่มเติม
- All
- Double Top
- Flag
- Head and Shoulders
- Pennant
- Rectangle
- Triangle
- Triple top
- All
- #AAPL
- #AMZN
- #Bitcoin
- #EBAY
- #FB
- #GOOG
- #INTC
- #KO
- #MA
- #MCD
- #MSFT
- #NTDOY
- #PEP
- #TSLA
- #TWTR
- AUDCAD
- AUDCHF
- AUDJPY
- AUDUSD
- EURCAD
- EURCHF
- EURGBP
- EURJPY
- EURNZD
- EURRUB
- EURUSD
- GBPAUD
- GBPCHF
- GBPJPY
- GBPUSD
- GOLD
- NZDCAD
- NZDCHF
- NZDJPY
- NZDUSD
- SILVER
- USDCAD
- USDCHF
- USDJPY
- USDRUB
- All
- M5
- M15
- M30
- H1
- D1
- All
- Buy
- Sale
- All
- 1
- 2
- 3
- 4
- 5
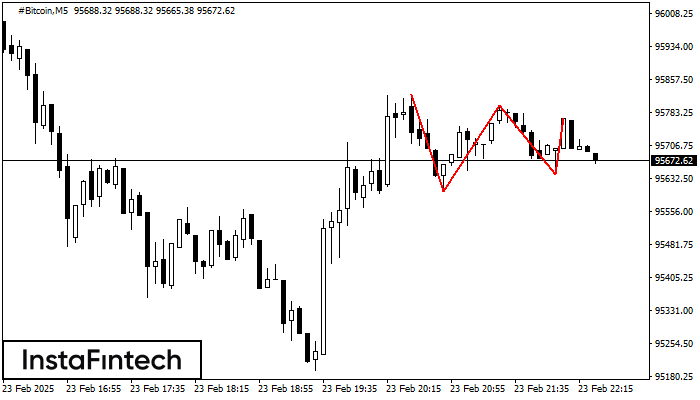
รูปแบบ รูปแบบกราฟจุดสามยอด (Triple Top) ได้สร้างขึ้นมาในชาร์ตของ #Bitcoin M5 ที่เป็นตราสารการซื้อขาย มันเป็นกราฟรูปแบบกราฟรูปแบบย้อนกลับ ที่มีคุณลักษณะดังต่อไปนี้ : ระดับของแนวต้าน 5489, ระดับของแนวรับ -3942
ขอบเตระยะเวลาใน M5 และ M15 อาจจะมีตำแหน่งการเข้าใช้งานที่ผิดพลาดมากยิ่งขึ้น
Open chart in a new window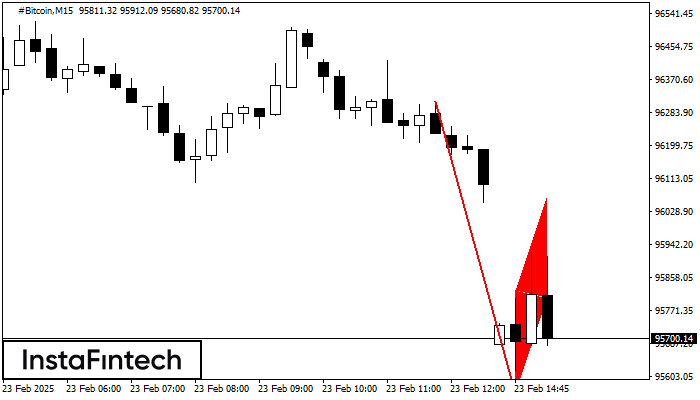
รูปแบบ รูปแบบกราฟธงขาลง (Bearish Flag) ได้ถูกสร้างขึ้นมาใน #Bitcoin ที่ M15 ขอบเขตด้านล่างของรูปแบบนี้จะอยุ่ใน 95559.90/95805.76 ขณะที่ขอบเขตด้านบนอยู่ใน 95823.54/96069.40 ตัวของเสาธงอยู่ที่ 75445 จุด
ขอบเตระยะเวลาใน M5 และ M15 อาจจะมีตำแหน่งการเข้าใช้งานที่ผิดพลาดมากยิ่งขึ้น
Open chart in a new windowwas formed on 23.02 at 15:27:48 (UTC+0)
signal strength 2 of 5
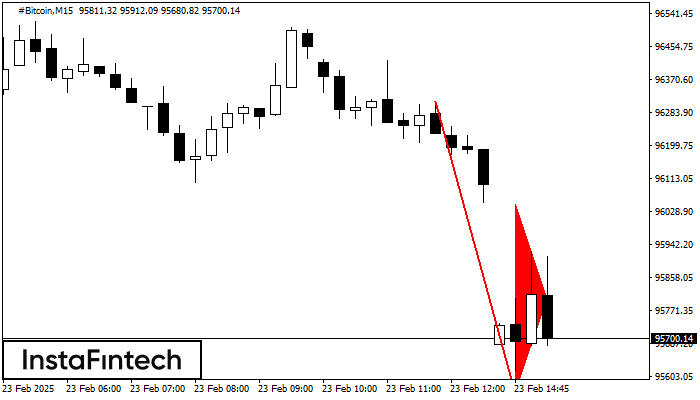
รูปแบบ รูปแบบกราฟธงปลายแหลมขาลง (Bearish pennant) ได้สร้างขึ้นมาในชาร์ต #Bitcoin M15 รูปแบบนี้แสดงถึงความต่องเนื่องของแนวโน้มขาลง กรณีที่มีการเคลื่อนตัวทะลุผ่านของระดับต่ำในรูปธงปลายแหลมที่ 95559.90 ออกไป คำแนะนำ: กำหนดคำสั่งซื้อขายล่วงหน้า(pending order)
ขอบเตระยะเวลาใน M5 และ M15 อาจจะมีตำแหน่งการเข้าใช้งานที่ผิดพลาดมากยิ่งขึ้น
Open chart in a new window


