empty
09.02.2023 01:55 PM
Bitcoin drops below $23k following stock indices: what does Google have to do with it and should we expect a correction?

Bitcoin continues to consolidate within the $22.8k–$23.4k area. The cryptocurrency still has bullish potential, but reacts extremely sharply to external events. A key role in this is played by stock indices, which maintain a high level of correlation with the asset.

Volatility spikes and sharp changes in the direction of price movement occur within the consolidation range of $22.8k–$23k. Given this, there is no need to talk about a radical change in the dynamics of Bitcoin, but sellers manage to make the most of the volatility spikes.

Situation with Google and stock markets

In the current trading week, Bitcoin was very close to the start of a corrective movement with a potential of $21.6k–$22.4k. However, according to the results of Tuesday, February 7, buyers finally managed neutralize the advantage of the bears.

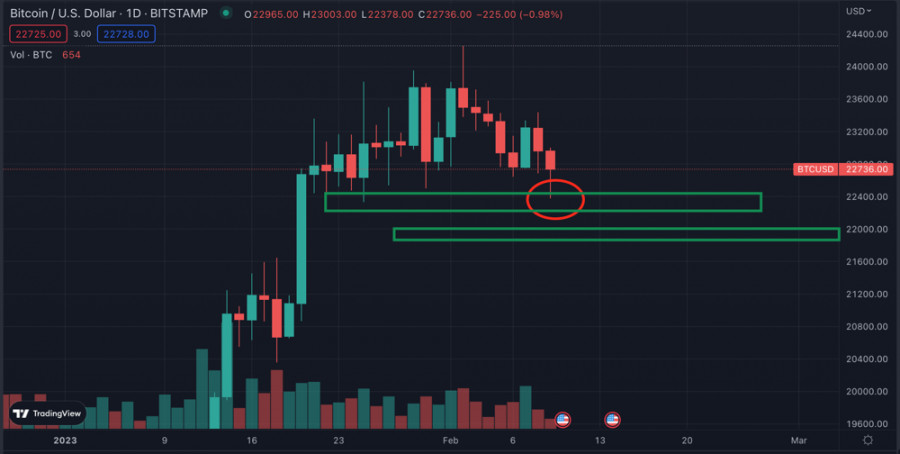
However, the next two days led to another increase in bearish volumes. Bitcoin ended the previous trading day near $22.6k. As of writing, the cryptocurrency has finally broken through the $22.8k support level.

This image is no longer relevant

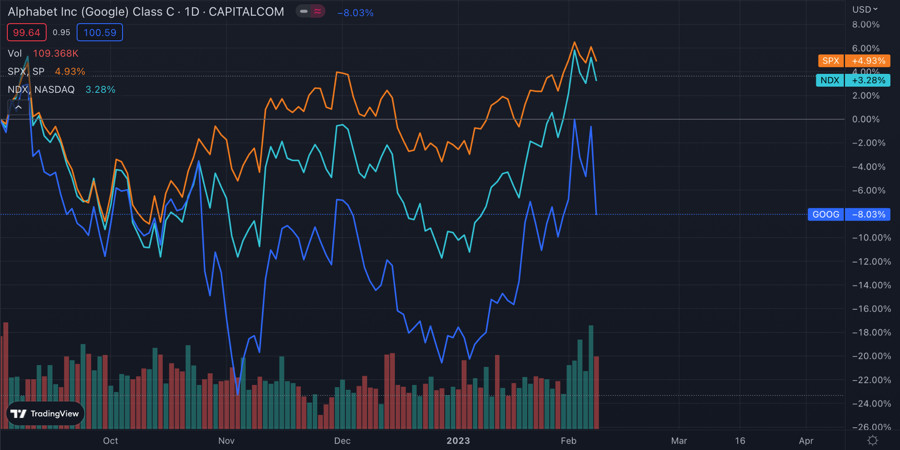
Among the key catalysts for the cryptocurrency's downward spurt are the stock market and the situation with Google shares. Users have reportedly found a factual bug in Google's artificial intelligence technology.

This provoked a sharp drop in the shares of the world giant and had a negative impact on the quotes of other indices. The S&P 500 tested the $4,000 level and struggled to stay above it. Other stock assets also dipped following the results of yesterday's trading day.

This image is no longer relevant

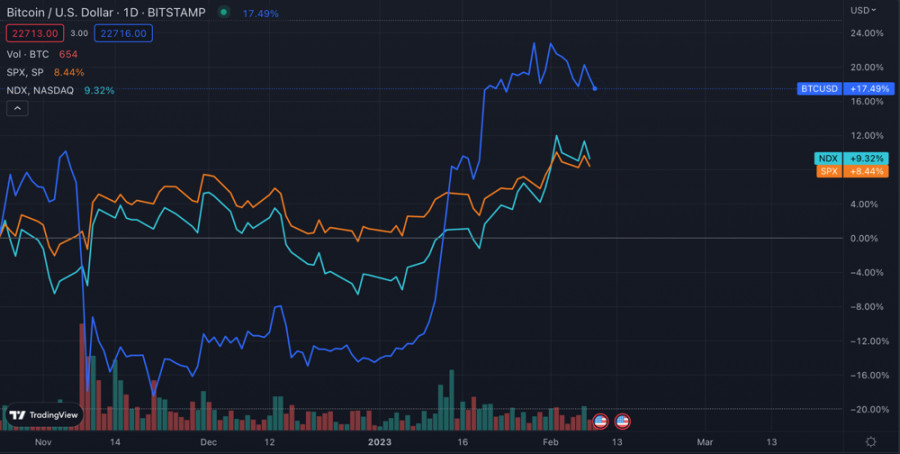
The wave of volatility hit the crypto market due to the high level of correlation between BTC, SPX and NDX. The only difference is that the consequences for Bitcoin may be more unpleasant than for stock indices.

However, do not assume that the local stock market crash will not escalate into a large-scale correction. Analysts at Goldman Sachs report that companies in the S&P 500 continue to approve buybacks for 2023 at a record pace, which are a key part of the bullish trend in assets.

BTC/USD Analysis

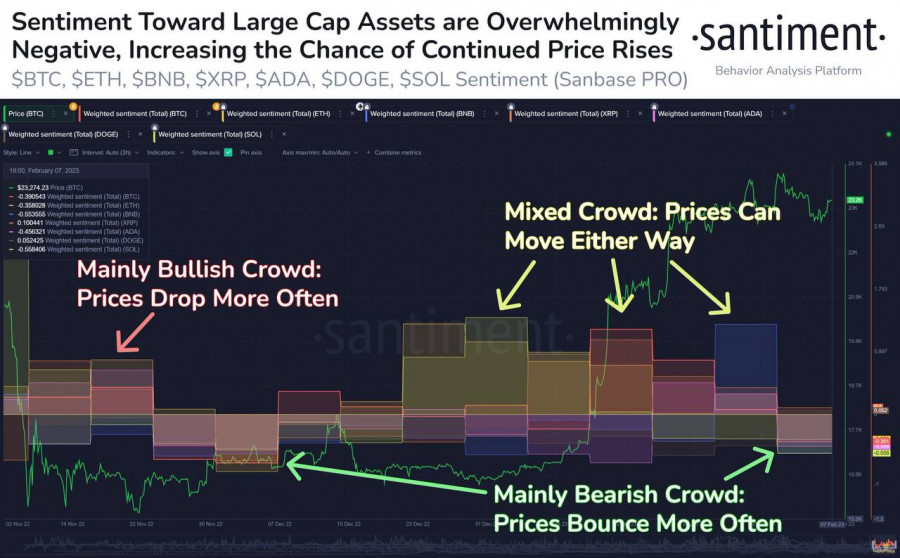
Despite all the movements in the global economy and the stock market, Bitcoin continues to be in demand. Santiment reports that BTC outflows from exchanges continue, and cryptocurrency reserves on platforms have reached their lowest level since November 2018.

This image is no longer relevant

At the same time, Santiment reports that the expectations of a rally in January for the crowd are gradually replaced by skepticism in February. This can be a signal for growth when building up short positions, but also a catalyst for a corrective movement when forming a sequence of red candles and breaking through important support levels.

This image is no longer relevant

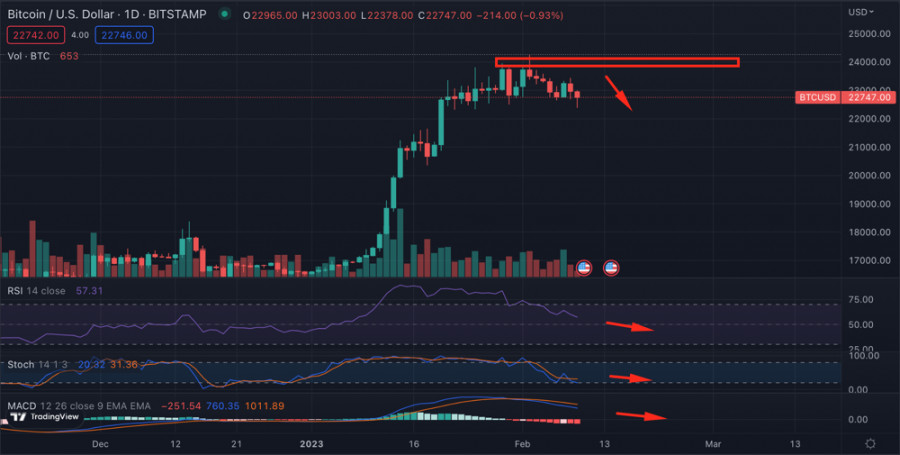
As of writing, Bitcoin is trading below the $22.8k level, which is an important springboard for a bullish move. If the asset fails to recover above $22.8k at the end of the current trading day, we can expect a further fall to the $22.4k level.

This image is no longer relevant

Technical metrics continue to decline: RSI and stochastic are gradually moving to the lower part of the bullish zone. On the daily chart of the cryptocurrency, the lower wick continues to form and grow, indicating that buyers are becoming more active.

This reduces the probability of a $22.4k retest, but we are not yet seeing a massive pullback. If BTC price fails to consolidate above $22.8k, it will continue to decline to the $22.4k level; and lower to $22k.

Results

To maintain the structure of the bullish trend, Bitcoin needs to recover above $22.8k. As of writing, there are not enough buying volumes, but there is every reason to believe that with the opening of the U.S. markets, investors will begin to buy back yesterday's fall and BTC will be able to recover.

เลือกช่วงเวลา
5
นาที
15
นาที
30
นาที
1
ชั่วโมง
4
ชั่วโมง
1
วัน
1
สัปดาห์
รับผลกำไรจากการเปลี่ยนแปลงอัตราสกุลเงินดิจิทัลกับ InstaForex.
ดาวน์โหลด MetaTrader 4 และเปิดการซื้อขายครั้งแรกของคุณ.
EUR/USD. วันที่ 23 พฤษภาคม การวิเคราะห์ด้วยระบบ Smart Money หลังจากการสลายของโครงสร้างขาลง เราได้เห็นการเพิ่มขึ้นอย่างแข็งแกร่งของยูโร ซึ่งในตอนนี้ ยังไม่สามารถถือว่าเสร็จสมบูรณ์ โครงสร้างแนวโน้มขาขึ้นใหม่ยังคงสมบูรณ์ และเราได้เห็นการปรับฐานถอยกลับทั้งสองเป็นผลและความไม่สมดุลของแนวโน้มขาขึ้นที่ใกล้ที่สุด ดังนั้น การเคลื่อนไหวขึ้นของยูโรอาจดำเนินต่อไปในระยะสั้น ความไม่สมดุลที่สองได้หยุดการลดลงและกระตุ้นปฏิกิริยาขาขึ้น ในเดือนมีนาคมที่ผ่านมา ฉันคาดหวังว่าจะเกิดการปรับฐานราคาที่ลึกขึ้น แต่สิ่งนั้นไม่เกิดขึ้นหลังจากการประชุมของ Fed หรือข้อมูลเศรษฐกิจของสหรัฐฯ เราต้องรอการเจรจาการค้าระหว่างสหรัฐฯ–จีน
บิทคอยน์ วันที่ 23 พฤษภาคม การวิเคราะห์ระบบสมาร์ทมันนี่ บิทคอยน์ยังคงสร้างโครงสร้างแนวโน้มกระทิงต่อเนื่อง อาจมีข้อถกเถียงได้ว่าในขณะนี้มีเหตุผลจริงในการสร้างแนวโน้มกระทิงรอบใหม่หรือไม่ แต่จากชาร์ตนั้นบ่งบอกอย่างชัดเจนเท่านั้น—อย่างไม่มีข้อกังขา เพราะว่าขณะนี้มีการสร้างคลื่นขาขึ้นขึ้นมา เทรดเดอร์สามารถทำได้เพียงรอให้ราคาย่างก้าวเข้าสู่โซนที่สนใจเพื่อให้มีโอกาสเข้าซื้อในทิศทางขาขึ้น ซึ่งโซนเหล่านี้คือ Imbalance 3 และ 4 การกลับไปยังพื้นที่ที่เกิดภาวะไม่สมดุลจะหมายถึงตลาดได้ปรับราคาสมดุลแล้ว จากนั้นการเติบโตของ Bitcoin อาจดำเนินต่อไป สำหรับผม
  • Grand Choice
    Contest by
    InstaForex
    InstaForex always strives to help you
    fulfill your biggest dreams.
    เข้าร่วมการแข่งขัน


บทความแนะนำ

บิทคอยน์ วันที่ 23 พฤษภาคม การวิเคราะห์ระบบสมาร์ทมันนี่

บิทคอยน์ยังคงสร้างโครงสร้างแนวโน้มกระทิงต่อเนื่อง อาจมีข้อถกเถียงได้ว่าในขณะนี้มีเหตุผลจริงในการสร้างแนวโน้มกระทิงรอบใหม่หรือไม่ แต่จากชาร์ตนั้นบ่งบอกอย่างชัดเจนเท่านั้น—อย่างไม่มีข้อกังขา เพราะว่าขณะนี้มีการสร้างคลื่นขาขึ้นขึ้นมา เทรดเดอร์สามารถทำได้เพียงรอให้ราคาย่างก้าวเข้าสู่โซนที่สนใจเพื่อให้มีโอกาสเข้าซื้อในทิศทางขาขึ้น ซึ่งโซนเหล่านี้คือ Imbalance 3 และ 4 การกลับไปยังพื้นที่ที่เกิดภาวะไม่สมดุลจะหมายถึงตลาดได้ปรับราคาสมดุลแล้ว จากนั้นการเติบโตของ Bitcoin อาจดำเนินต่อไป สำหรับผม

Samir Klishi 20:04 2025-05-23 UTC+2

เจ้าหน้าที่ TRUMP: ชุมชนคริปโต, การประท้วง, และการเมือง

ในช่วงเย็นของวันที่ 22 พฤษภาคม 2568 ได้เกิดเหตุการณ์พิเศษที่ Trump National Golf Club ในรัฐเวอร์จิเนีย — งานเลี้ยงอาหารค่ำที่จัดโดย Donald Trump ร่วมกับผู้ถือโทเคน

Jurij Tolin 16:49 2025-05-23 UTC+2

การวิเคราะห์ทางเทคนิคของการเคลื่อนไหวราคาภายในวันของสกุลเงินคริปโต Doge, วันศุกร์ที่ 23 พฤษภาคม 2025

ดูเหมือนว่าการเคลื่อนไหวของราคาของ Doge Cryptocurrency ในกราฟ 4 ชั่วโมง กำลังเคลื่อนที่เหนือ WMA (21) ซึ่งมีความชันขึ้นไปด้านบน และตัวบ่งชี้ Stochastic Oscillator กำลังพร้อมที่จะข้ามสัญญาณซื้อ (BUY)

Arief Makmur 09:04 2025-05-23 UTC+2

การวิเคราะห์ทางเทคนิคของการเคลื่อนไหวของราคาภายในวันของสกุลเงินดิจิทัล Ripple, วันศุกร์ที่ 23 พฤษภาคม 2025

หากเราดูที่กราฟ 4 ชั่วโมงของสกุลเงินดิจิทัล Ripple จะเห็นได้ว่ามันเคลื่อนตัวขึ้นเหนือ WMA (21) ซึ่งมีความชันสูงและประสบความสำเร็จในการทะลุขึ้นเหนือระดับ High Value Area (สีเหลือง) แล้วต่อไปเคลื่อนตัวขึ้นเหนือพื้นที่สีน้ำเงิน (ค่าเฉลี่ย) และอยู่ในพื้นที่ที่มีอารมณ์ของผู้ซื้อซึ่งค่อนข้างมาก

Arief Makmur 09:04 2025-05-23 UTC+2

การคาดการณ์ราคา Bitcoin สำหรับวันที่ 23 พฤษภาคม ปี 2025

ในวันพฤหัสบดี ราคาของ Bitcoin ได้แตะระดับเป้าหมายที่ 111,770 การแกว่งตัวของออสซิลเลเตอร์ Marlin ดูเหมือนจะตามหลังราคาอยู่ ทำให้เกิดภาพของการแยกตัวที่ไม่เป็นไปตามมาตรฐานชั้นสูง แต่ในขณะนี้ เรายังคงยึดตามสถานการณ์ที่ออสซิลเลเตอร์จะพัฒนาอยู่ภายในช่องแนวโน้มขึ้นระยะยาว การปรับฐานจากระดับปัจจุบันมีความเป็นไปได้อย่างแน่นอน ระดับอ้างอิงคือ 109,985 ซึ่งเป็นระดับสูงสุดเมื่อวันที่

Laurie Bailey 04:45 2025-05-23 UTC+2

Bitcoin ตั้งเป้าทะยานสู่ $120,000? เกิดอะไรขึ้นเบื้องหลังการพุ่งขึ้นครั้งนี้ และควรคาดหวังการถอยกลับเมื่อใด

เมื่อวันที่ 22 พฤษภาคม Bitcoin ได้ทะลุผ่านระดับ $111,888 อย่างมั่นใจ ทำให้เกิดสถิติใหม่สูงสุดที่ $111,867 ซึ่งไม่เหมือนกับการพุ่งทะยานครั้งก่อนที่มีการเฉลิมฉลองจากนักลงทุนรายย่อย แต่ครั้งนี้พฤติกรรมของตลาดมีความแตกต่างออกไป ผู้เข้าร่วมในตลาดกำลังพูดกันมากขึ้นไม่ใช่เกี่ยวกับความคลั่งไคล้ในการเก็งกำไร แต่เกี่ยวกับการเปลี่ยนแปลงพื้นฐานในการมอง Bitcoin ในโลกการเงิน

Ekaterina Kiseleva 16:12 2025-05-22 UTC+2

บิตคอยน์ยังคงขยายตัวขึ้นอย่างมั่นใจ

ดูเหมือนว่าความต้องการ Bitcoin กำลังเพิ่มขึ้นอย่างรวดเร็ว เมื่อพิจารณาจากประสิทธิภาพล่าสุด ขณะที่เผยแพร่บทความนี้ คู่ BTC/USD ซื้อขายอยู่ใกล้ 111,200.00 ซึ่งลดลงเล็กน้อยจากราคาสูงสุดของวันนี้และราคาสูงสุดตลอดกาลที่ 111,865.00 โดยรวมในเดือนที่ยังคงดำเนินอยู่นี้ ราคาขึ้น 18% ทำลายสถิติเดิมที่

Jurij Tolin 16:02 2025-05-22 UTC+2

Bitcoin: $115,000 — ราคาถัดไปหรือกับดักกระทิง?

บิทคอยน์กำลังเคลื่อนที่เข้าใกล้จุดสูงสุดตลอดกาลของมันอย่างมั่นคง และตามที่นักวิเคราะห์หลายท่านกล่าวไว้ มันพร้อมที่จะสร้างสถิติใหม่ ระดับปัจจุบันที่ใกล้เคียง $105,000 ไม่ได้เป็นเพียงแค่ตัวเลข — แต่มันบ่งบอกว่าสินทรัพย์คริปโตนี้กำลังกลับมาแข็งแกร่งอีกครั้ง กระตุ้นความสนใจจากทั้งนักเทรดทั่วไปและสถาบันต่างๆ แต่ภายใต้การเคลื่อนที่ที่มั่นใจนี้กลับมีความซับซ้อนแฝงอยู่ นี่คือการวิเคราะห์ว่าทำไมตลาดจึงเชื่อใน $115,000 — และสิ่งที่อาจผิดพลาดได้ สถานการณ์ที่กลัวที่สุดของฝั่งกระทิง—การเกิดจุดสูงสุดสองเท่า—ได้กลายเป็นหัวข้อร้อนแรง

Ekaterina Kiseleva 00:58 2025-05-21 UTC+2

การวิเคราะห์ BTC/USD ในวันที่ 20 พฤษภาคม 2025

ลายเส้นคลื่นบนกราฟ 4 ชั่วโมงสำหรับ BTC/USD ได้กลายเป็นซับซ้อนมากขึ้นในเดือนที่ผ่านมา ความกระทบทางด้านลงต่ำเราสังเกตว่ามีการสร้างโครงสร้างลงที่สำเร็จตอนที่ระดับ 75,000 ดังนั้นจึงตามมาด้วยการเคลื่อนขึ้นอย่างแข็งแกร่ง ซึ่งอาจทำเครื่องหมายว่าจุดเริ่มต้นของแนวโน้มกระตุ้นใหม่ คลื่นแรกของส่วนพวกนี้ดูเหมือนว่าจะสมบูรณ์ แต่คลื่นที่สองดูเล็กมากและไม่น่าเชื่อถือเลย พื้นหลังข่าวสนับสนุน Bitcoin แต่บางทีก็ไม่ค่อยจะเสมอและคง่งหมั่น ผมจะขอพูดว่าผู้มีส่วนร่วมในตลาดตัวเองตีความความสัมพันธ์ใด

Chin Zhao 11:11 2025-05-20 UTC+2

การวิเคราะห์ทางเทคนิคของการเคลื่อนไหวของราคาคริปโตเคอเรนซี Ethereum รายวัน วันศุกร์ที่ 16 พฤษภาคม 2025

หากเราดูที่กราฟ 4 ชั่วโมง สกุลเงินคริปโต Ethereum ดูเหมือนจะเคลื่อนไหวเหนือ WMA (21) ซึ่งเป็นแนวรับแบบไดนามิกที่ WMA มีความลาดเอียงเพิ่มขึ้น ดังนั้นจากข้อมูลนี้จึงเป็นการบ่งชี้ว่าในอีกไม่กี่วันข้างหน้า #ETH มีศักยภาพที่จะมีการแข็งค่าต่อได้ โดยระดับ

Arief Makmur 06:09 2025-05-16 UTC+2
หากไม่สะดวกคุยในตอนนี้
ระบุคำถามไว้ได้ใน แชท.
Widget callback
 

Dear visitor,

Your IP address shows that you are currently located in the USA. If you are a resident of the United States, you are prohibited from using the services of InstaFintech Group including online trading, online transfers, deposit/withdrawal of funds, etc.

If you think you are seeing this message by mistake and your location is not the US, kindly proceed to the website. Otherwise, you must leave the website in order to comply with government restrictions.

Why does your IP address show your location as the USA?

  • - you are using a VPN provided by a hosting company based in the United States;
  • - your IP does not have proper WHOIS records;
  • - an error occurred in the WHOIS geolocation database.

Please confirm whether you are a US resident or not by clicking the relevant button below. If you choose the wrong option, being a US resident, you will not be able to open an account with InstaForex anyway.

We are sorry for any inconvenience caused by this message.