empty
07.04.2023 12:06 AM
Technical analysis of EUR/USD for April 06, 2023

This image is no longer relevant

Overview :

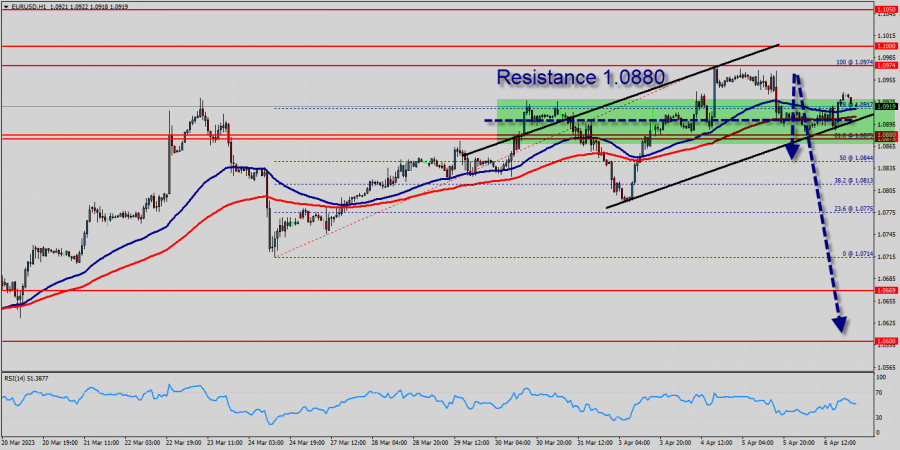
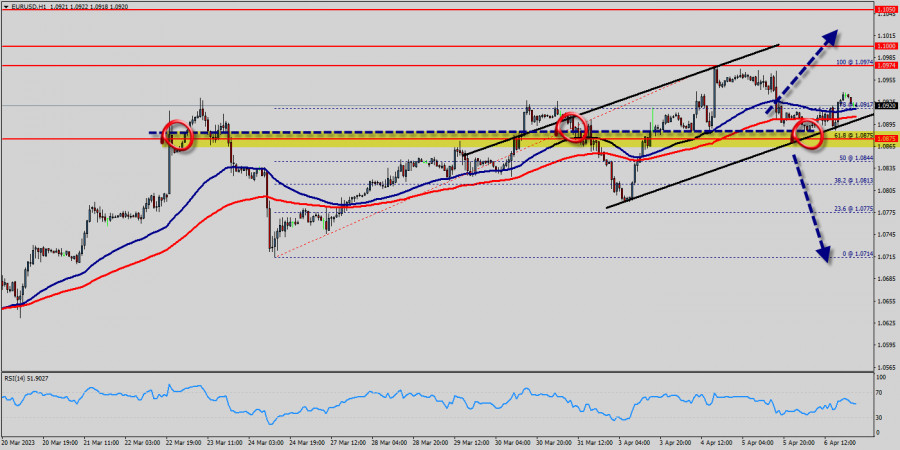
Since last week, the EUR/USD pair has faced strong resistances at the levels of 1.0880 because support had become resistance last week. So, the strong resistance has been already formed at the level of 1.0880 and the pair is likely to try to approach it in order to test it again. However, if the pair fails to pass through the level of 1.0880, the market will indicate a bearish opportunity below the new strong resistance level of 1.0880 (the level of 1.0880 coincides with a ratio of 61.8% Fibonacci - last bullish wave - double top).

Moreover, the RSI starts signaling a downward trend, as the trend is still showing strength above the moving average (100) and (50). The trend of EUR/USD pair movement was controversial as it took place in the downtrend channel. Due to the previous events, the price is still set between the levels of 1.0808 and 1.0669, so it is recommended to be careful while making deals in these levels because the prices of 1.0808 and 1.0669 are representing the resistance and support respectively.

It is necessary to wait till the downtrend channel is passed through. Then the market will probably show the signs of a bearish market. It should be noted that the volatility is very high for that the price of the EUR/USD pair is still trading between the prices of 1.0669 and 1.0808 in the coming hours. Furthermore, the price has been set below the strong resistance at the levels of 1.0808 and 1.0851 which coincide with the ratios of Fibonacci retracement levels respectively. Thus, the market is indicating a bearish opportunity below 1.0880 so it will be good to sell at 1.0808 with the first target of 1.0669.

It will also call for a downtrend in order to continue towards 1.0630. The daily strong support is seen at 1.0600. However, the stop loss should always be taken into account, for that it will be reasonable to set your stop loss at the level of 1.0851. Moving averages, in the meantime, maintain their bearish slope way above the current level.

Furthermore, although the news is bearish for the EUR/USD pair, professional may not want to sell weakness, but rather following a rebound rally. Additionally, some aggressive counter-trend buyers may be defending parity. In case a continuisions takes place and the EUR/USD pair breaks through the support level of 1.0669, a further decline to 1.0600 can occur which would indicate a bearish market.

The EUR/USD pair didn't make any significant movements yesterday. There are no changes in our technical outlook. The bias remains bearish in the nearest term testing 1.0669 or lower. Immediate support is seen around 1.0669. A clear break below that area could lead price to the neutral zone in the nearest term. Price will test 1.06030, because in general, we remain bearish on between Feb 13rd and Feb 18th, 2023. The market moved from its bottom at 1.0669 and continued to rise towards the top of 1.0680. Today, on the one-hour chart, the current rise will remain within a framework of correction.

This image is no longer relevant

However, if the pair fails to pass through the level of 1.0732 (major resistance), the market will indicate a bearish opportunity below the strong resistance level of 1.0669 (the level of 1.0669 coincides with the ratio of 00% Fibonacci retracement - last bearish wave). This resistance has been rejected several times confirming the downtrend. Additionally, the RSI starts signaling a downward trend.

The trend is still below the 100 EMA for that the bearish outlook remains the same as long as the 100 EMA is headed to the downside. Since there is nothing new in this market, it is not bullish yet. Sell deals are recommended below the level of 1.0669 with the first target at 1.0630 so as to test the double bottom. If the trend breaks the double bottom level of 1.0600, the pair is likely to move downwards continuing the development of a bearish trend to the level of 1.0600 in order to test the weekly support 2. The third weekly support is set at the price of 1.0543.

เลือกช่วงเวลา
5
นาที
15
นาที
30
นาที
1
ชั่วโมง
4
ชั่วโมง
1
วัน
1
สัปดาห์
รับผลกำไรจากการเปลี่ยนแปลงอัตราสกุลเงินดิจิทัลกับ InstaForex.
ดาวน์โหลด MetaTrader 4 และเปิดการซื้อขายครั้งแรกของคุณ.
  • Grand Choice
    Contest by
    InstaForex
    InstaForex always strives to help you
    fulfill your biggest dreams.
    เข้าร่วมการแข่งขัน


บทความแนะนำ

สัญญาณการซื้อขายสำหรับทองคำ (XAU/USD) วันที่ 10-12 เมษายน 2025: ขายต่ำกว่า $3,145 (21 SMA - 8/8 Murray)

ในช่วงเช้าของตลาดสหรัฐฯ ทองคำซื้อขายอยู่ที่ประมาณ 3,120 ใกล้กับระดับต้าน 8/8 Murray เราเชื่อว่าทองคำอาจมีการปรับตัวทางเทคนิคที่แข็งแกร่งในชั่วโมงถัดไป หลังจากหาจุดสนับสนุนที่ดีใกล้กับระดับ 6/8 ของ Murray 2,968 ทองคำได้ฟื้นตัวอย่างแข็งแกร่งไปยังระดับ 3,130 ดังนั้น

Dimitrios Zappas 15:37 2025-04-10 UTC+2

EUR/USD วันที่ 10 เมษายน: ทรัมป์ยังคงสร้างความผันผวนให้ตลาด

ในวันพุธ คู่เงิน EUR/USD ได้เกิดการดีดตัวสองครั้งจากโซนแนวต้านที่ 1.1081–1.1095 ซึ่งเป็นการสนับสนุนให้กับเงินดอลลาร์สหรัฐ และลดลงสู่โซนแนวรับที่ 1.0944–1.0957 การดีดตัวจากโซนนี้จะเป็นประโยชน์ต่อเงินยูโรและอาจกระตุ้นให้เกิดการเติบโตกลับไปยังระดับ 1.1081–1.1095 ในปัจจุบัน ฉันยังไม่คาดหวังถึงการลดลงที่ลึกลงไป แม้ว่าหลายอย่างจะขึ้นอยู่กับสถานการณ์ข้อมูล ซึ่งเนื่องจากทรัมป์ ยังคงมีความผันผวนสูง

Samir Klishi 12:19 2025-04-10 UTC+2

การคาดการณ์สำหรับ GBP/USD ในวันที่ 10 เมษายน 2025

ในกราฟรายชั่วโมง คู่สกุลเงิน GBP/USD ได้รีบาวด์จากระดับ 1.2865 ในวันพุธ และมีการลดลงเล็กน้อย จากนั้นในวันนี้กลับมาที่ระดับเดิมอีกครั้ง การรีบาวด์อีกครั้งจากระดับนี้จะเป็นสัญญาณที่ดีสำหรับดอลลาร์สหรัฐและบ่งชี้ถึงการลดลงไปยังระดับ 1.2709 การปรับตัวขึ้นเหนือระดับ 1.2865 จะเพิ่มโอกาสในการเติบโตต่อไปสู่ระดับแนวต้านถัดไปที่ 1.2931 สถานการณ์คลื่นได้กลายเป็นที่สับสนในช่วงหลังนี้

Samir Klishi 12:12 2025-04-10 UTC+2

การคาดการณ์ Forex วันที่ 10/04/2025: EUR/USD, SP500, NASDAQ, Dow Jones, USDX และ Bitcoin

ลิงก์ที่เป็นประโยชน์: บทความอื่น ๆ ของฉันมีให้ในส่วนนี้ หลักสูตร InstaForex สำหรับผู้เริ่มต้น การวิเคราะห์ยอดนิยม เปิดบัญชีซื้อขาย สำคัญ: ผู้เริ่มต้นในการเทรดฟอเร็กซ์ควรระมัดระวังอย่างมากในการตัดสินใจเข้าตลาด ก่อนที่จะมีการเผยแพร่รายงานที่สำคัญ ควรจะอยู่ห่างจากตลาดเพื่อหลีกเลี่ยงความผันผวนที่แอบมากจากการเคลื่อนไหวของตลาดที่รุนแรงที่อาจเกิดขึ้น หากคุณตัดสินใจที่จะเทรดในช่วงที่มีการเผยแพร่ข่าว ให้ตั้งค่าหยุดคำสั่งเพื่อลดการขาดทุน

Sebastian Seliga 11:35 2025-04-10 UTC+2

การวิเคราะห์ทางเทคนิคของการเคลื่อนไหวราคาภายในวันของดัชนี Nasdaq 100, วันพฤหัสบดีที่ 10 เมษายน 2025

จากแผนภูมิ 4 ชั่วโมงของดัชนี Nasdaq 100 ที่เห็นได้ในขณะนี้ ถึงแม้ว่าจะมีการแข็งค่าของ #NDX ซึ่งได้รับการยืนยันจากการเคลื่อนไหวของราคาอยู่เหนือ WMA (30 Shift 2) ที่มีแนวโน้มชี้ขึ้น และได้รับการสนับสนุนโดยการแสดงออกถึง

Arief Makmur 10:14 2025-04-10 UTC+2

การวิเคราะห์ทางเทคนิคของการเคลื่อนไหวของราคาประจำวันของคู่สกุลเงินต่างประเทศ USD/IDR ประจำวันพฤหัสบดีที่ 10 เมษายน 2025

ในกราฟรายวัน คู่สกุลเงินแปลกใหม่ USD/IDR ดูเหมือนจะมีอคติเชิงบวกที่ค่อนข้างแข็งแกร่งซึ่งบ่งบอกโดยการเคลื่อนไหวของราคาที่อยู่เหนือ EMA (21) ของมัน แต่เนื่องจากปัจจุบันราคายังคงติดอยู่ที่ระดับ 161.8% Fibonacci Expansion Resistance ที่ 16944.74 และอินดิเคเตอร์

Arief Makmur 10:14 2025-04-10 UTC+2

USD/JPY: อัตราเงินเฟ้อที่ชะลอตัวในสหรัฐฯ อาจกดดันคู่สกุลเงินนี้

ค่าเงินเยนของญี่ปุ่นร่วงลงอย่างมากในวันก่อนหน้า เนื่องจากข่าวที่ไม่คาดคิดเกี่ยวกับการหยุดพักการทำสงครามการค้าเป็นเวลา 90 วัน การพัฒนานี้สนับสนุนค่าเงินดอลลาร์ แต่ยังไม่แน่ชัดว่าการเติบโตนี้จะดำเนินต่อไปหรือไม่ ข้อมูลเงินเฟ้อผู้บริโภคของสหรัฐในวันนี้คาดว่าจะชะลอตัวลงในเดือนมีนาคม หากยืนยัน ข้อมูลดังกล่าวอาจทำให้คู่สกุลเงินนี้ลดลงอย่างรวดเร็ว เนื่องจากจะเพิ่มความคาดหวังว่าธนาคารกลางสหรัฐจะลดอัตราดอกเบี้ยอย่างน้อยหนึ่งครั้งในปีนี้ ในขณะเดียวกัน ธนาคารแห่งประเทศญี่ปุ่นมีแนวโน้มที่จะขึ้นอัตราดอกเบี้ย สิ่งนี้บ่งชี้ถึงการแยกทางของนโยบายอัตราดอกเบี้ยที่เพิ่มขึ้น จากมุมมองทางเทคนิค คู่สกุลเงินนี้มีการซื้อขายภายในช่วงกว้างระหว่าง

Pati Gani 09:56 2025-04-10 UTC+2

การพยากรณ์ EUR/USD สำหรับวันที่ 10 เมษายน 2025

เมื่อวานนี้ ประธานาธิบดี Donald Trump ของสหรัฐฯ ได้ลดอัตราภาษีลงเหลือ 10% เป็นเวลา 90 วัน สำหรับประเทศที่ไม่ตอบโต้ภาษีเริ่มแรกของสหรัฐฯ (ทั้งหมดมากกว่า 75 ประเทศ) ขณะที่อัตราภาษีต่อจีนถูกเพิ่มขึ้นเป็น

Laurie Bailey 05:08 2025-04-10 UTC+2

การคาดการณ์ GBP/USD สำหรับวันที่ 10 เมษายน 2025

เมื่อวันพุธที่ผ่านมา เงินปอนด์อังกฤษได้ทำการเคลื่อนไหวผ่านช่วงเป้าหมายที่ 1.2816/47 อย่างครบถ้วน แต่ตามที่คาดการณ์ไว้ มันไม่สามารถยืนอยู่เหนือช่วงนี้ได้ และได้เข้าสู่ช่วงการปรับฐานในบริเวณนี้แทน วันนี้ ราคาเปิดเหนือเส้นบ่งชี้ดุล (ค่าเฉลี่ยเคลื่อนที่สีแดง) และยังอยู่ในช่วงราคาปัจจุบัน ซึ่งบ่งชี้ถึงโอกาสในการเติบโตต่อไป เป้าหมายต่อไปด้านบนคือ 1.3001 และเป้าหมายถัดไปคือ

Laurie Bailey 05:08 2025-04-10 UTC+2

การพยากรณ์ USD/JPY สำหรับวันที่ 10 เมษายน 2025

ความผันผวนที่เพิ่มสูงขึ้นใน USD/JPY เมื่อวานนี้ ไม่สามารถเปลี่ยนแปลงความรู้สึกเชิงลบได้—ตัวแท่งเทียนไม่ปิดเหนือเส้นสมดุล การลดลงในเช้าวันนี้เกือบจะครอบคลุมแท่งเทียนสีขาวของเมื่อวาน ราคากำลังพยายามกลับลงมาต่ำกว่าช่วงราคาสนับสนุนที่ 145.08/91 โดยมีเป้าหมายเพื่อทดสอบที่ 143.45 ซึ่งถัดจากนั้นเป้าหมายถัดไปจะเป็น 141.70 ซึ่งสอดคล้องกับราคาต่ำสุดในเดือนธันวาคม 2023 สิงหาคม และกันยายน

Laurie Bailey 05:08 2025-04-10 UTC+2
หากไม่สะดวกคุยในตอนนี้
ระบุคำถามไว้ได้ใน แชท.
Widget callback
 

Dear visitor,

Your IP address shows that you are currently located in the USA. If you are a resident of the United States, you are prohibited from using the services of InstaFintech Group including online trading, online transfers, deposit/withdrawal of funds, etc.

If you think you are seeing this message by mistake and your location is not the US, kindly proceed to the website. Otherwise, you must leave the website in order to comply with government restrictions.

Why does your IP address show your location as the USA?

  • - you are using a VPN provided by a hosting company based in the United States;
  • - your IP does not have proper WHOIS records;
  • - an error occurred in the WHOIS geolocation database.

Please confirm whether you are a US resident or not by clicking the relevant button below. If you choose the wrong option, being a US resident, you will not be able to open an account with InstaForex anyway.

We are sorry for any inconvenience caused by this message.