empty
29.03.2023 05:25 PM
Technical analysis of GBP/USD for March 29, 2023

This image is no longer relevant

Overview:

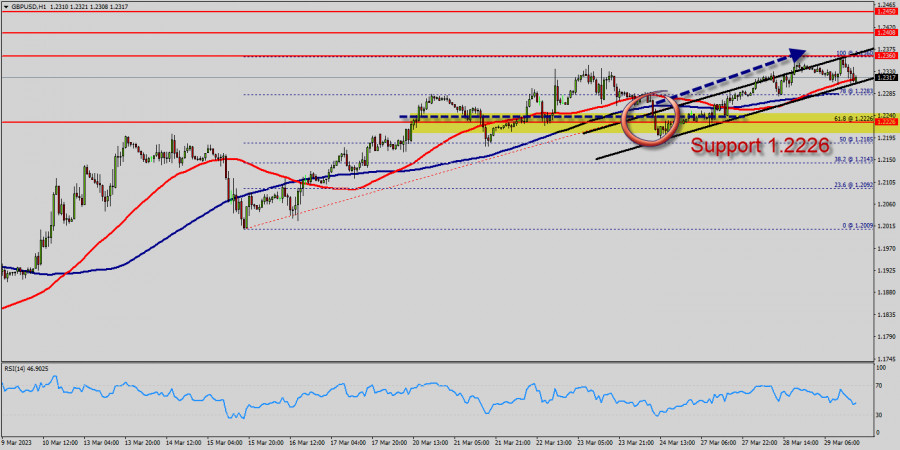
The GBP/USD pair has faced strong support at the level of 1.2226 because resistance became support. So, the strong resistance has been already faced at the level of 1.2226 and the pair is likely to try to approach it in order to test it again. The level of 1.2121 represents a weekly pivot point for that it is acting as minor support this week. Furthermore, the EUR/USD pair is continuing to trade in a bullish trend from the new support level of 1.2173. Currently, the price is in a bullish channel. According to the previous events, we expect the EUR/USD pair to move between 1.2121 and 1.2341. Also, it should be noticed that the double top is set at 1.2341. Additionally, the RSI is still signaling that the trend is upward as it remains strong above the moving average (100). This suggests the pair will probably go up in coming hours. Accordingly, the market is likely to show signs of a bullish trend. In other words, buy orders are recommended above 1.2226 with the first target at the level of 1.2341. If the trend is be able to break the double top at the level of 1.2341, then the market will continue rising towards the weekly resistance 1 at 1.2400. On the other hand, if the GBP/USD pair fails to break through the resistance level of 1.2341 this week, the market will decline further to 1.2121. The pair is expected to drop lower towards at least 1.2100 with a view to test the weekly pivot point. Also, it should be noted that the weekly pivot point will act as minor support today at the price 1.2121.

ndicators :

This would suggest a bearish market because the moving average (100) is still in a positive area and does not show any trend-reversal signs at the moment. EMAs gives more weight to the most recent periods, because moving average is quick moving and works well at showing recent price swings. On the other hand, Simple Moving Average (SMA) displays a smooth chart which which removes most false signals. Moreover, with using SMAs, you can know whether a pair is trending up or trending down. Consequently, if you want to obtain a clearer signal of whether the pair is trending up or down if you combine two or more moving averages because simple and exponential are the two major types of moving averages.

Signals:

The trend is still bullish as long as the price of 1.2226 is not broken. Thereupon, it would be wise to buy below the price of at 1.2226 with the primary target at 1.2360. Then, the GBP/USD pair will continue towards the second target at 1.2408 . The breakdown of 1.2226 will allow the pair to go further down to the prices of 1.2121.

เลือกช่วงเวลา
5
นาที
15
นาที
30
นาที
1
ชั่วโมง
4
ชั่วโมง
1
วัน
1
สัปดาห์
รับผลกำไรจากการเปลี่ยนแปลงอัตราสกุลเงินดิจิทัลกับ InstaForex.
ดาวน์โหลด MetaTrader 4 และเปิดการซื้อขายครั้งแรกของคุณ.
  • Grand Choice
    Contest by
    InstaForex
    InstaForex always strives to help you
    fulfill your biggest dreams.
    เข้าร่วมการแข่งขัน


บทความแนะนำ

USD/JPY: การวิเคราะห์และการพยากรณ์

คู่เงินนี้ยังคงเคลื่อนไหวแบบคงที่ในกรอบแคบๆ โดยไม่มีการเปลี่ยนแปลงที่ชัดเจน จากมุมมองด้านเทคนิค การคงความแข็งแกร่งเหนือระดับจิตวิทยา 145.00 และการเคลื่อนขึ้นที่ชัดเจน จะยืนยันสัญญาณที่เป็นรั้นของการทะลุกรอบการซื้อขายที่เป็นรูปแบบมาหลายสัปดาห์ เนื่องจากดัชนี Relative Strength Index (RSI) เพิ่งเริ่มต้นมีทิศทางบวก USD/JPY อาจจะทะลุระดับสูงสุดรายเดือนไปจนใกล้

Irina Yanina 20:41 2025-06-17 UTC+2

การคาดการณ์สำหรับ EUR/USD ประจำวันที่ 17 มิถุนายน 2025

ในวันจันทร์ คู่สกุลเงิน EUR/USD ยังคงเคลื่อนที่ขึ้นต่อไป และสามารถยืนเหนือระดับปรับตัว 100.0% ที่ 1.1574 แต่ไม่สามารถเคลื่อนที่ขึ้นต่อได้ การปิดต่ำกว่าระดับ 1.1574 เปิดประตูไปสู่การลดลงที่อาจจะเกิดขึ้นจนถึงระดับปรับตัว 76.4% ที่ 1.1454

Samir Klishi 12:00 2025-06-17 UTC+2

พยากรณ์อัตราแลกเปลี่ยน 17/06/2025: EUR/USD, USD/JPY, NZD/USD, SP500 และ Bitcoin

ลิงก์ที่มีประโยชน์: บทความอื่นๆ ของฉันสามารถอ่านได้ในส่วนนี้ หลักสูตรสำหรับผู้เริ่มต้นของ InstaForex การวิเคราะห์ยอดนิยม เปิดบัญชีเทรด สำคัญ: ผู้เริ่มต้นในการเทรดฟอเร็กซ์ควรระมัดระวังอย่างมากเมื่อทำการตัดสินใจเกี่ยวกับการเข้าตลาด ก่อนการประกาศรายงานสำคัญ ควรหลีกเลี่ยงการเข้าไปในตลาดเพื่อหลีกเลี่ยงความผันผวนของตลาดที่สูงขึ้นซึ่งอาจทำให้เกิดการเปลี่ยนแปลงที่รุนแรง หากคุณตัดสินใจเทรดในช่วงประกาศข่าว ควรใช้คำสั่งหยุดขาดทุนเสมอเพื่อจำกัดการสูญเสีย หากไม่ใช้คำสั่งหยุดขาดทุน คุณอาจสูญเสียเงินฝากทั้งหมดได้อย่างรวดเร็ว

Sebastian Seliga 10:46 2025-06-17 UTC+2

การคาดการณ์สำหรับ GBP/USD ณ วันที่ 17 มิถุนายน 2025

บนกราฟรายชั่วโมง คู่เงิน GBP/USD ในวันจันทร์ได้พุ่งขึ้นอีกครั้งไปยังโซนแนวต้านระหว่าง 1.3611 ถึง 1.3633 จากนั้นได้ถอยกลับ และเปลี่ยนไปในทิศทางที่สนับสนุนดอลลาร์สหรัฐ การเคลื่อนไหวนี้ไม่ใช่สัญญาณที่ดีสำหรับดอลลาร์ เนื่องจากปัจจุบันมีผู้เชื่อน้อยมากในเรื่องของการขึ้นอย่างแข็งแกร่งของ USD สามความพยายามล่าสุดในการก้าวลงไปต่ำกว่าระดับ 127.2%

Samir Klishi 10:18 2025-06-17 UTC+2

การวิเคราะห์ทางเทคนิคของการเคลื่อนไหวของราคาในระหว่างวันของคู่สกุลเงินตัดกัน GBP/JPY วันอังคารที่ 17 มิถุนายน 2025

หากเราดูที่กราฟ 4 ชั่วโมง คู่สกุลเงิน GBP/JPY กำลังเคลื่อนไหวในแนวโน้มขาขึ้น ซึ่งยืนยันได้จากการเคลื่อนไหวของราคาที่เคลื่อนที่อยู่ในช่องทางขาขึ้นที่ชี้ขึ้นด้านบนและอยู่เหนือ WMA (21) ซึ่งมีความลาดเอียงชี้ขึ้นเช่นกัน แต่ด้วยสภาวะของตัวบ่งชี้ Stochastic Oscillator ที่อยู่ในระดับเขตซื้อมากเกินไป บ่งชี้ถึงความเป็นไปได้ในการปรับฐานที่อ่อนลงในอนาคตอันใกล้

Arief Makmur 06:38 2025-06-17 UTC+2

การวิเคราะห์ทางเทคนิคของการเคลื่อนไหวราคาทองคำในระหว่างวัน วันอังคารที่ 17 มิถุนายน 2025

ในกราฟ 4 ชั่วโมง เครื่องมือสินค้าทองดูเหมือนจะมี Divergence ระหว่างการเคลื่อนไหวของราคาทองกับตัวบ่งชี้ Stochastic Oscillator ซึ่งบ่งชี้ว่าในอนาคตอันใกล้นี้ ทองมีแนวโน้มที่จะอ่อนตัวลงเพื่อลองทดสอบระดับ 3378.89 หากสามารถตัดผ่านและปิดตลาดใต้ระดับดังกล่าวได้สำเร็จ ทองก็มีความเป็นไปได้ที่จะอ่อนตัวลงต่อไปยังระดับพื้นที่ 3319.20-3295.12 เป็นเป้าหมายหลัก

Arief Makmur 06:38 2025-06-17 UTC+2

การคาดการณ์ค่าเงิน EUR/USD สำหรับวันที่ 17 มิถุนายน 2025

ค่าเงินยูโรยังคงแสดงความยืดหยุ่นท่ามกลางความเสี่ยงทางภูมิรัฐศาสตร์ แต่ไม่ใช่ว่าจะทำได้ด้วยตัวเอง ค่าน้ำมันและการปรับฐานทางเทคนิคในตลาดหุ้นยังคงให้การสนับสนุน โดยสะท้อนให้เห็นถึงความสัมพันธ์แบบเดียวกันกับที่เคยเห็นในปี 2003 ช่วงเริ่มต้นของสงครามสหรัฐ–อิรัก เช้านี้ เงินยูโรมีการทรงตัวเหนือระดับ 1.1535 ซึ่งเป็นสัญญาณความพร้อมที่จะพุ่งขึ้นไปที่ระดับ 1.1692 อย่างไรก็ตาม การเคลื่อนไหวนี้อาจแข็งแกร่งยิ่งขึ้น—ไปยังเส้นกรอบราคาที่ใกล้ 1.1820—เนื่องจากการตัดสินใจเกี่ยวกับนโยบายทางการเงินของ FOMC

Laurie Bailey 04:51 2025-06-17 UTC+2

การพยากรณ์ค่าคู่สกุลเงิน GBP/USD สำหรับวันที่ 17 มิถุนายน 2025

สกุลเงินปอนด์อังกฤษกำลังถูกบีบระหว่างเส้น MACD บนกราฟรายวันและระดับแนวต้านที่ 1.3635 คำถามสำคัญตอนนี้คือ: ในอีกไม่กี่วันข้างหน้า ราคาจะทะลุในทิศทางใด? การทดสอบของ Marlin oscillator ที่ขอบล่างของช่องของตัวเองนั้นเพิ่มความเป็นไปได้ของการเบรกขึ้นด้านบน การยืนยันจะเกิดขึ้นเมื่อราคาเบรกขึ้นเหนือระดับ 1.3635 เป้าหมายที่ใกล้ที่สุดจากนั้นจะเป็นเส้นช่องราคาภายในที่ 1.3760

Laurie Bailey 04:48 2025-06-17 UTC+2

การพยากรณ์ AUD/USD สำหรับวันที่ 17 มิถุนายน 2025

ค่าเงินดอลลาร์ออสเตรเลียได้มีการเคลื่อนไหวเพื่อปรับฐานอยู่ใกล้เส้นกรอบราคาขาขึ้นที่ระดับ 0.6550 ติดต่อกันถึงแปดช่วงการซื้อขายแล้ว ขณะที่ออสซิลเลเตอร์ Marlin ได้มีการเคลื่อนไหวเพื่อปรับฐานอยู่เหนือเส้นศูนย์มาตั้งแต่วันที่ 28 พฤษภาคม อย่างไรก็ตาม แนวโน้มยังคงเป็นขาขึ้น การเคลื่อนไหวของราคากำลังพัฒนาเหนือเส้นอินดิเคเตอร์ ทั้งคู่และไม่มีอะไรขัดแย้งกับสถานการณ์หลัก ซึ่งชี้ว่าราคาจะเพิ่มขึ้นไปยังระดับ 0.6650 หลังจากที่ทะลุผ่านเส้นช่องทางราคาภายในแล้ว

Laurie Bailey 04:48 2025-06-17 UTC+2

XAU/USD: การวิเคราะห์และการคาดการณ์

ทองคำกำลังปรับตัวลดลงในช่วงวัน ปัจจัยบวกโดยรวมในตลาดหุ้นกำลังลดความต้องการในทองคำแท่ง อย่างไรก็ตาม มีหลายปัจจัยที่ทำให้ตลาดหมีไม่สามารถเข้ายึดพื้นที่ได้อย่างหนักแน่น ช่วยให้ราคาทองคำยืนเหนือระดับสำคัญที่ $3400 ความตึงเครียดด้านภูมิรัฐศาสตร์ที่เพิ่มขึ้นในตะวันออกกลางยังคงกดดันความเชื่อมั่นของตลาด ทำให้เกิดความกังวลเกี่ยวกับความไม่แน่นอนของโลก นอกจากนี้ การคาดว่า Federal Reserve จะลดอัตราดอกเบี้ยในปี 2025 ทำให้ค่าเงินดอลลาร์สหรัฐไม่แข็งค่ามากขึ้น

Irina Yanina 12:18 2025-06-16 UTC+2
หากไม่สะดวกคุยในตอนนี้
ระบุคำถามไว้ได้ใน แชท.
Widget callback
 

Dear visitor,

Your IP address shows that you are currently located in the USA. If you are a resident of the United States, you are prohibited from using the services of InstaFintech Group including online trading, online transfers, deposit/withdrawal of funds, etc.

If you think you are seeing this message by mistake and your location is not the US, kindly proceed to the website. Otherwise, you must leave the website in order to comply with government restrictions.

Why does your IP address show your location as the USA?

  • - you are using a VPN provided by a hosting company based in the United States;
  • - your IP does not have proper WHOIS records;
  • - an error occurred in the WHOIS geolocation database.

Please confirm whether you are a US resident or not by clicking the relevant button below. If you choose the wrong option, being a US resident, you will not be able to open an account with InstaForex anyway.

We are sorry for any inconvenience caused by this message.