empty
14.09.2022 07:29 PM
Technical analysis of EUR/USD for September 14, 2022

This image is no longer relevant

Overview :

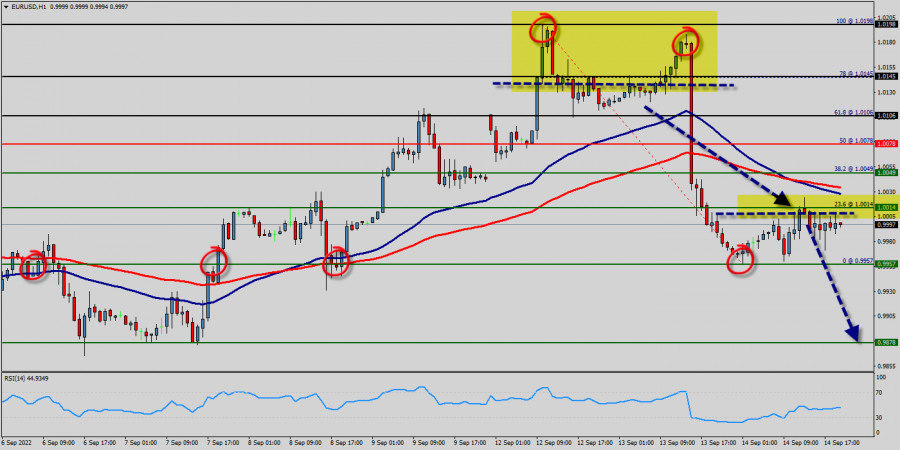
The EUR/USD pair stayed below the psychological level of 1.0078 over the week, indicating a lack of urgency to accumulate at the current levels. The bears are attempting to extend EUR/USD pair's decline below 0.9957 to bottomed at 1 USD right now.

The EUR/USD pair remains downside for consolidation below 1.0078 temporary low. Downside of recovery should be limited by 0.9957 support turned resistance to bring another fall.

The Euro pair depreciated further to 1 USD, the lowest level in this week, falling towards parity against the dollar on concerns the energy crisis would lead Europe's region to a deep recession, placing the ECB between a rock and a hard place as it tries to curb inflation and rest a slowing economy. The EUR/USD pair decreased within adown channel.

It then trimmed losses, dropping to 0.9957. The move lower took place amid a stronger US dollar across the board. Probably, the main scenario is continued decline towards 0.9800 (sentiment level). Some fundamental news will impact on the EUR/USD pair in coming days because The euro has a flexible exchange rate, which is dependent on three factors : The European Central Bank's benchmark interest rate. Additionally, the debt levels of individual countries within the EU. Moreover, the strength of the European economy.

Closing below the pivot point (1.0078) could assure that the EUR/USD pair will move lower towards cooling new lows. Then, the bears must break through the price of 1 USD n order to resume the downtrend.

The trend is still below the 100 EMA for that the bearish outlook remains the same as long as the 100 EMA is headed to the downside. Hence, the price spot of 1.0078 remains a significant resistance zone.

Also it should notice that the Euro is edging lower against the U.S. Dollar late in the session this morning in a volatile session that saw the single currency posting an early loss before continuing after data in the U.S. showed the world's largest economy created more jobs than expected this month.

Since the trend is below the 50% Fibonacci level (1.0078), the market is still in a downtrend. Overall, we still prefer the bearish scenario. Consequently, there is a possibility that the EUR/USD pair will move downside. The structure of a fall does not look corrective.

If the pair fails to pass through the level of 0.9957, the market will indicate a bearish opportunity below the strong resistance level of 1.0078.

The trend is still calling for a strong bearish market from the spot of 1.0078. Sellers are asking for a high price. In this regard, sell deals are recommended lower than the 1.0078 level with the first target at 0.9957.

It is possible that the pair will carry on downwards continuing the development of the bearish trend to the level 0.9878.

However, stop loss has always been in consideration thus it will be useful to set it above the last double top at the level of 1.0198 (notice that the major resistance today has set at 1.0198). Please check out the market volatility before investing, because the sight price may have already been reached and scenarios might have become invalidated.

เลือกช่วงเวลา
5
นาที
15
นาที
30
นาที
1
ชั่วโมง
4
ชั่วโมง
1
วัน
1
สัปดาห์
รับผลกำไรจากการเปลี่ยนแปลงอัตราสกุลเงินดิจิทัลกับ InstaForex.
ดาวน์โหลด MetaTrader 4 และเปิดการซื้อขายครั้งแรกของคุณ.
  • Grand Choice
    Contest by
    InstaForex
    InstaForex always strives to help you
    fulfill your biggest dreams.
    เข้าร่วมการแข่งขัน


บทความแนะนำ

สัญญาณการเทรดสำหรับ EUR/USD ในวันที่ 24-26 เมษายน 2025: ขายต่ำกว่า 1.1435 (21 SMA - 7/8 Murray)

ในช่วงต้นของเซสชั่นอเมริกา คู่สกุลเงิน EUR/USD กำลังซื้อขายอยู่ที่ระดับ 1.1358 ภายในช่องแนวโน้มขาลงที่เริ่มเมื่อวันที่ 18 เมษายน คู่สกุลเงินนี้ยังถูกกดดันจากแรงขาย เราเชื่อว่าเครื่องมือการเงินนี้ยังมีทางลงอีกยาวไกลกว่าจะถึงก้นของช่องแนวโน้มขาลง ยูโรคาดว่าจะฟื้นตัวในชั่วโมงต่อๆ ไป และขึ้นไปถึงระดับ 1.1429 บนกราฟ

Dimitrios Zappas 17:06 2025-04-24 UTC+2

การพยากรณ์ Forex วันที่ 24/04/2025: EUR/USD, GBP/USD, SP500, ทองคำ และ Bitcoin

ลิงก์ที่มีประโยชน์: บทความอื่นๆ ของฉันสามารถอ่านได้ในส่วนนี้ คอร์ส InstaForex สำหรับผู้เริ่มต้น การวิเคราะห์ยอดนิยม เปิดบัญชีซื้อขาย สำคัญ: นักลงทุนมือใหม่ในตลาดฟอเร็กซ์จำเป็นต้องระมัดระวังอย่างมากเมื่อตัดสินใจเข้าตลาด ก่อนการเปิดเผยรายงานสำคัญควรหลีกเลี่ยงการเข้าไปในตลาดเพื่อหลบเลี่ยงความผันผวนที่รุนแรง อันเนื่องมาจากความผันแปรที่เพิ่มขึ้น หากคุณตัดสินใจที่จะเทรดในช่วงที่มีการเผยแพร่ข่าวสาร ควรตั้งคำสั่งหยุดขาดทุนเสมอเพื่อช่วยลดความเสี่ยงในการขาดทุน หากไม่มีการตั้งคำสั่งหยุดขาดทุน

Sebastian Seliga 13:25 2025-04-24 UTC+2

ทองคำ: ราคาอาจลดลงอย่างมากในอนาคตอันใกล้นี้

ราคาทองคำได้ปรับตัวลดลงอย่างชัดเจนเมื่อเร็วๆ นี้ ท่ามกลางความคาดหวังในตลาดเกี่ยวกับการเริ่มต้นการเจรจาจริงระหว่างสหรัฐฯ และจีน เรื่องภาษีและการค้าภาพรวม คำแถลงของรัฐมนตรีคลัง S. Bessent ที่กล่าวว่าการทำสงครามภาษีในปัจจุบันระหว่างปักกิ่งและวอชิงตันไม่มีประโยชน์ บ่งบอกว่าการเจรจากำลังเกิดขึ้นเบื้องหลัง และอาจมีการบรรลุข้อตกลงในอนาคตอันใกล้นี้ ในทางเทคนิค ราคาของ "โลหะสีเหลือง" มีการกลับตัวลงในท้องถิ่น

Pati Gani 09:38 2025-04-24 UTC+2

การวิเคราะห์ทางเทคนิคสำหรับการเคลื่อนไหวของราคาสินค้าโภคภัณฑ์เงิน ประจำวันที่พฤหัสบดีที่ 24 เมษายน 2025

ในกราฟ 4 ชั่วโมง เครื่องมือที่ใช้สำหรับการซื้อขายเงิน (Silver) แสดงให้เห็นสภาพที่กำลังแข็งแกร่งขึ้น ซึ่งยืนยันได้จากการเคลื่อนไหวของราคาเงินที่เคลื่อนที่อยู่เหนือเส้น WMA (30 Shift 2) ที่มีแนวโน้มขึ้น แต่การปรากฎของ Divergence ระหว่างการเคลื่อนที่ของราคาและตัวบ่งชี้

Arief Makmur 06:18 2025-04-24 UTC+2

การวิเคราะห์เชิงเทคนิคของการเคลื่อนไหวของดัชนี Nasdaq 100 วันพฤหัสบดีที่ 24 เมษายน 2025

แม้ว่าในกราฟ 4 ชั่วโมง ดัชนี Nasdaq 100 จะอยู่ในทิศทาง Sideways แต่ช่วงช่วงนั้นค่อนข้างกว้างจึงยังมีโอกาสที่ค่อนข้างน่าสนใจในดัชนีนี้ ขณะนี้ตัวชี้วัด Stochastic Oscillator อยู่ในสภาวะ Crossing SELL

Arief Makmur 06:18 2025-04-24 UTC+2

สัญญาณการซื้อขายสำหรับทองคำ (XAU/USD) ระหว่างวันที่ 23-25 เมษายน 2025: ขายต่ำกว่า $3,333 (200 EMA - 6/8 Murray)

ในช่วงต้นของตลาดสหรัฐฯ ทองคำมีการซื้อขายอยู่ที่ประมาณ 3,333 ภายในช่องขาลงที่เกิดขึ้นเมื่อวันที่ 22 เมษายน XAU/USD แสดงสัญญาณของการขายเกินและกำลังกระเด้งหลังจากถึงระดับ Murray 6/8 และพื้นที่ 200 EMA ทองคำอาจจะยังคงอยู่ในแนวโน้มขาลง ถ้ามันลดลงต่ำกว่า

Dimitrios Zappas 14:31 2025-04-23 UTC+2

การวิเคราะห์ทางเทคนิคของการเคลื่อนไหวราคาภายในวันของคู่สกุลเงินไขว้ AUD/JPY วันพุธที่ 23 เมษายน 2025

ด้วยการเกิดความแตกต่างระหว่างการเคลื่อนไหวของราคาในคู่สกุลเงิน AUD/JPY กับตัวบ่งชี้ Stochastic Oscillator และการเคลื่อนไหวของราคา AUD/JPY ที่อยู่เหนือ WMA (30 Shift 2) ซึ่งมีแนวโน้มสูงขึ้น ดังนั้นอิงตามข้อเท็จจริงทั้งสองข้อนี้ AUD/JPY

Arief Makmur 06:37 2025-04-23 UTC+2

การวิเคราะห์ทางเทคนิคของการเคลื่อนไหวราคาทองคำภายในวัน, วันพุธที่ 23 เมษายน 2025

หากเราพิจารณากราฟ 4 ชั่วโมง จะเห็นว่าเครื่องมือการเงิน Gold ยังคงเคลื่อนไหวในแนวโน้ม Bullish แต่การปรากฏของ Divergence ระหว่างการเคลื่อนไหวของราคาทองคำกับตัวชี้วัด Stochastic Oscillator บ่งบอกว่าในอนาคตอันใกล้นี้ ทองคำอาจเผชิญการปรับฐานอ่อนตัวลงไปสู่ระดับ 3310.31

Arief Makmur 06:37 2025-04-23 UTC+2

การคาดการณ์ค่าเงินต่างประเทศ 22/04/2025: EUR/USD, GBP/USD, USD/JPY และ Bitcoin

ลิงก์ที่เป็นประโยชน์: บทความอื่นๆ ของฉันสามารถอ่านได้ในส่วนนี้ คอร์สพื้นฐาน InstaForex สำหรับผู้เริ่มต้น การวิเคราะห์ยอดนิยม เปิดบัญชีซื้อขาย สำคัญ: สำหรับผู้เริ่มต้นในการเทรดฟอเร็กซ์ ควรระมัดระวังเป็นพิเศษเมื่อทำการตัดสินใจเกี่ยวกับการเข้าสู่ตลาด ก่อนที่รายงานสำคัญจะออก ควรหลีกเลี่ยงการเข้าตลาดเพื่อป้องกันการถูกกระทบจากความผันผวนของตลาดที่เพิ่มขึ้น หากตัดสินใจเทรดในช่วงที่มีการประกาศข่าว ควรตั้ง

Sebastian Seliga 10:08 2025-04-22 UTC+2

การวิเคราะห์ทางเทคนิคของการเคลื่อนไหวของราคาในระหว่างวันของคู่สกุลเงิน GBP/CHF, วันอังคารที่ 22 เมษายน 2025

หากเราพิจารณากราฟ 4 ชั่วโมงของคู่สกุลเงิน GBP/CHF จะพบข้อเท็จจริงที่น่าสนใจหลายประการ ประการแรก การปรากฏตัวของรูปแบบ Triangle ตามด้วยการเคลื่อนไหวของ EMA (21) ที่เคลื่อนที่ระหว่างตัวแท่งเทียนบ่งชี้ว่าสถานการณ์ปัจจุบันของ GBP/CHF กำลังเคลื่อนที่ในลักษณะ Sideways

Arief Makmur 06:58 2025-04-22 UTC+2
หากไม่สะดวกคุยในตอนนี้
ระบุคำถามไว้ได้ใน แชท.
Widget callback
 

Dear visitor,

Your IP address shows that you are currently located in the USA. If you are a resident of the United States, you are prohibited from using the services of InstaFintech Group including online trading, online transfers, deposit/withdrawal of funds, etc.

If you think you are seeing this message by mistake and your location is not the US, kindly proceed to the website. Otherwise, you must leave the website in order to comply with government restrictions.

Why does your IP address show your location as the USA?

  • - you are using a VPN provided by a hosting company based in the United States;
  • - your IP does not have proper WHOIS records;
  • - an error occurred in the WHOIS geolocation database.

Please confirm whether you are a US resident or not by clicking the relevant button below. If you choose the wrong option, being a US resident, you will not be able to open an account with InstaForex anyway.

We are sorry for any inconvenience caused by this message.