


signal strength 3 of 5

The Triple Bottom pattern has formed on the chart of AUDCHF M30. Features of the pattern: The lower line of the pattern has coordinates 0.5232 with the upper limit 0.5232/0.5218, the projection of the width is 26 points. The formation of the Triple Bottom pattern most likely indicates a change in the trend from downward to upward. This means that in the event of a breakdown of the resistance level 0.5206, the price is most likely to continue the upward movement.
Vea asimismo
- All
- Double Top
- Flag
- Head and Shoulders
- Pennant
- Rectangle
- Triangle
- Triple top
- All
- #AAPL
- #AMZN
- #Bitcoin
- #EBAY
- #FB
- #GOOG
- #INTC
- #KO
- #MA
- #MCD
- #MSFT
- #NTDOY
- #PEP
- #TSLA
- #TWTR
- AUDCAD
- AUDCHF
- AUDJPY
- AUDUSD
- EURCAD
- EURCHF
- EURGBP
- EURJPY
- EURNZD
- EURRUB
- EURUSD
- GBPAUD
- GBPCHF
- GBPJPY
- GBPUSD
- GOLD
- NZDCAD
- NZDCHF
- NZDJPY
- NZDUSD
- SILVER
- USDCAD
- USDCHF
- USDJPY
- USDRUB
- All
- M5
- M15
- M30
- H1
- D1
- All
- Buy
- Sale
- All
- 1
- 2
- 3
- 4
- 5
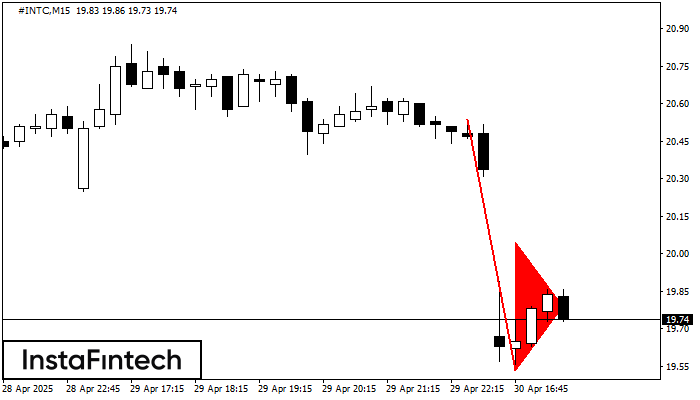
El patrón Banderín bajista se ha formado en el gráfico #INTC M15. El patrón señala la continuación de la tendencia bajista en caso de que se rompa el mínimo
Los marcos de tiempo M5 y M15 pueden tener más puntos de entrada falsos.
Open chart in a new window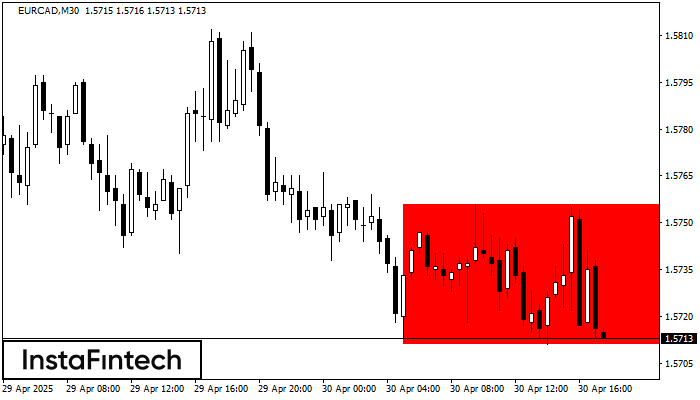
Según el gráfico de M30, EURCAD formó el Rectángulo Bajista que es un patrón de la continuación de una tendencia. El patrón está contenido dentro de los siguientes límites: límite
Open chart in a new window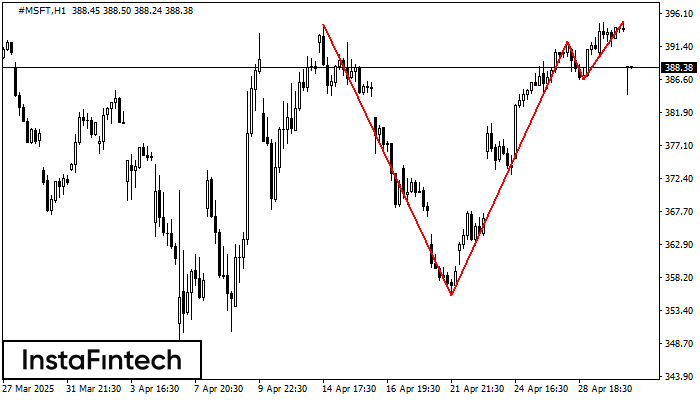
El patrón Triple Techo ha sido formado en el gráfico del instrumento de negociación #MSFT H1. Este es un patrón de reversión que presenta las siguientes características: nivel de resistencia
Open chart in a new window


