


signal strength 4 of 5
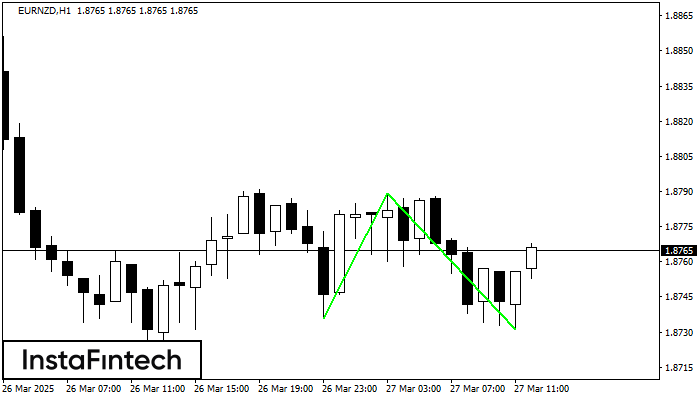
The Double Bottom pattern has been formed on EURNZD H1. This formation signals a reversal of the trend from downwards to upwards. The signal is that a buy trade should be opened after the upper boundary of the pattern 1.8789 is broken. The further movements will rely on the width of the current pattern 53 points.
- All
- Double Top
- Flag
- Head and Shoulders
- Pennant
- Rectangle
- Triangle
- Triple top
- All
- #AAPL
- #AMZN
- #Bitcoin
- #EBAY
- #FB
- #GOOG
- #INTC
- #KO
- #MA
- #MCD
- #MSFT
- #NTDOY
- #PEP
- #TSLA
- #TWTR
- AUDCAD
- AUDCHF
- AUDJPY
- AUDUSD
- EURCAD
- EURCHF
- EURGBP
- EURJPY
- EURNZD
- EURRUB
- EURUSD
- GBPAUD
- GBPCHF
- GBPJPY
- GBPUSD
- GOLD
- NZDCAD
- NZDCHF
- NZDJPY
- NZDUSD
- SILVER
- USDCAD
- USDCHF
- USDJPY
- USDRUB
- All
- M5
- M15
- M30
- H1
- D1
- All
- Buy
- Sale
- All
- 1
- 2
- 3
- 4
- 5
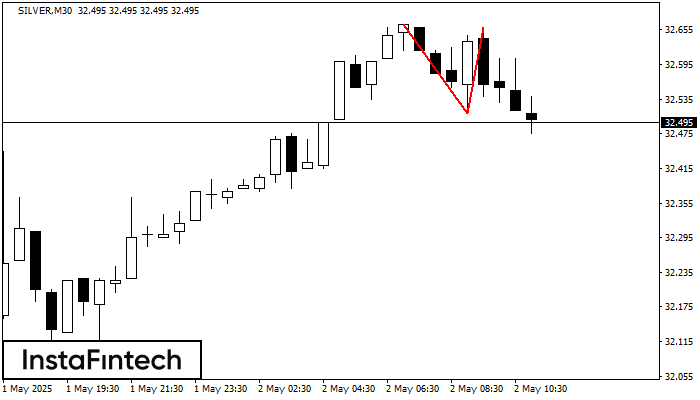
En el gráfico de SILVER M30 el patrón de reversión Doble Techo ha sido formado. Características: límite superior 32.66; límite inferior 32.51; el ancho del patrón 150 puntos. La señal
Open chart in a new window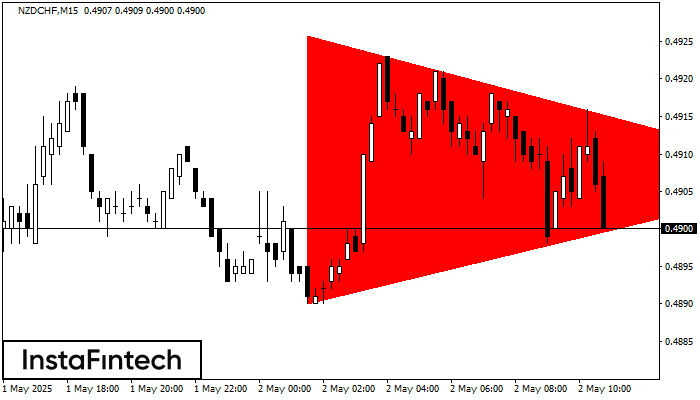
Según el gráfico de M15, el NZDCHF formó el patrón Triángulo Simétrico Bajista. Descripción: El límite inferior es 0.4890/0.4907 y el límite superior es 0.4926/0.4907. El ancho del patrón
Los marcos de tiempo M5 y M15 pueden tener más puntos de entrada falsos.
Open chart in a new window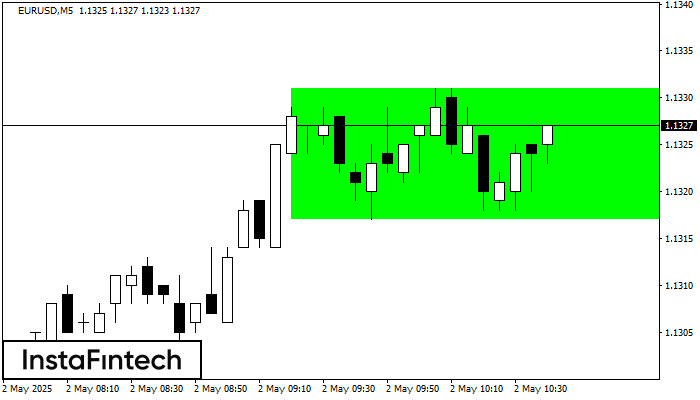
Según el gráfico de M5, EURUSD formó el Rectángulo Alcista. El patrón indica la continuación de una tendencia. El límite superior es 1.1331, el límite inferior es 1.1317. La señal
Los marcos de tiempo M5 y M15 pueden tener más puntos de entrada falsos.
Open chart in a new window


