empty
22.08.2024 01:51 PM
EUR/USD. August 22. Business activity index cools down buyer enthusiasm

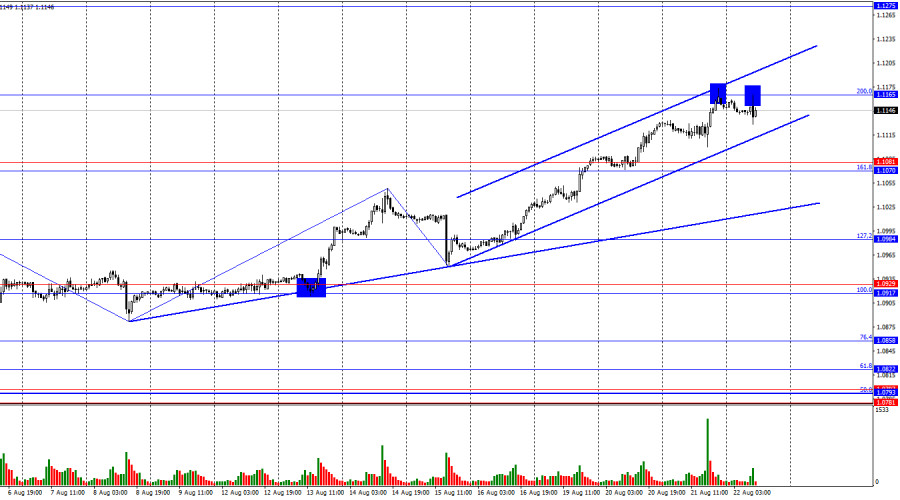
On Wednesday, the EUR/USD pair rose to the 200.0% corrective level at 1.1165. Two rejections from this level currently suggest a possible reversal in favor of the U.S. dollar and a slight decline toward the support zone of 1.1070–1.1081. However, it is not certain that the price will manage to consolidate below the upward trend channel, as the "bullish" trend remains very strong. The pair's growth would likely have continued this morning if the Eurozone business activity indices hadn't been weaker than expected. Consolidation above the 1.1165 level would signal a further rise toward the next Fibonacci level of 261.8% at 1.1318.

This image is no longer relevant

The wave situation has become a bit more complex but remains clear overall. The last completed downward wave did not break the low of the previous wave, while the new upward wave broke the peak from August 14. Thus, the "bullish" trend is still intact. For the "bullish" trend to be invalidated, the bears would need to break the low of the last downward wave, which is near the 1.0950 level.

The news flow on Wednesday was nearly nonexistent. Only in the second half of the day did the new Nonfarm Payrolls report (in annual terms) come in weaker than market expectations, triggering a new decline in the U.S. dollar. However, in my view, the decline of the U.S. currency would have continued even without this report, just as it did on Monday or Tuesday. This morning, business activity reports were released in Germany and the Eurozone. Three out of four indicators were weaker than expected. The only positive was the Eurozone services PMI, which rose from 51.9 to 53.3 points. As we can see, the impact of this information was only enough to pause the continuous growth. I don't believe that this pause marks the end. Typically, trends end abruptly, and we are not seeing any sharp reversals at the moment.

This image is no longer relevant

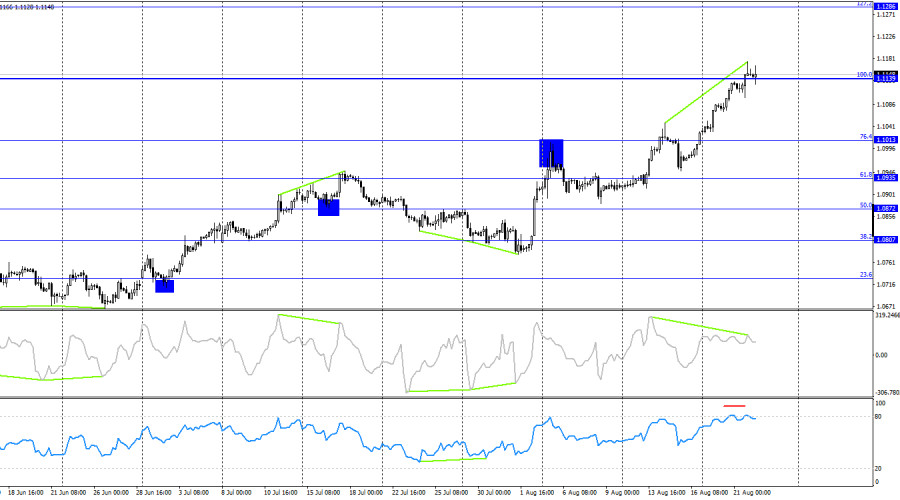
On the 4-hour chart, the pair rose to the 100.0% Fibonacci level at 1.1139 and held just above it. The CCI indicator has been signaling a "bearish" divergence for several days, and the RSI is in overbought territory. Thus, many factors suggest a potential decline in the pair by the end of the week. However, significant growth for the dollar seems unlikely at this point. Even if a downward trend begins, it will take quite some time to obtain the necessary confirmations. For now, I only anticipate a slight downward correction.

Commitments of Traders (COT) Report:

This image is no longer relevant

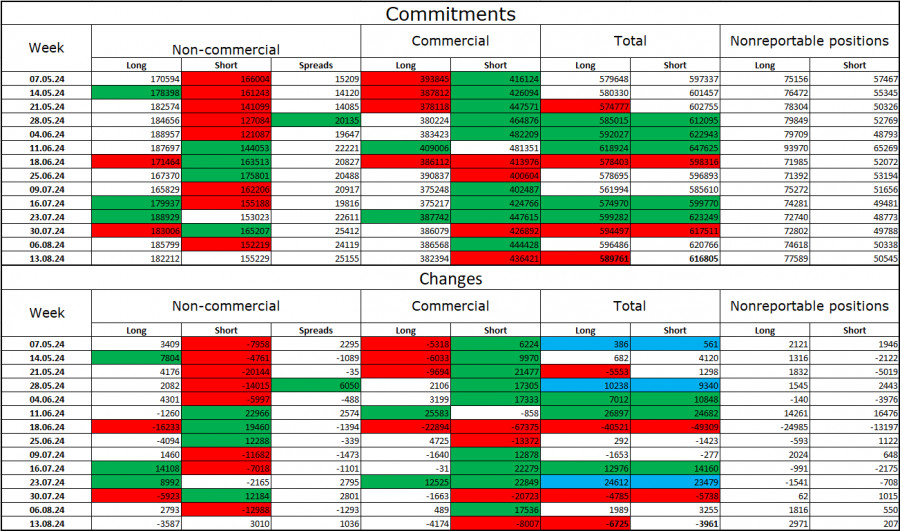
During the last reporting week, speculators closed 3,587 long positions and opened 3,010 short positions. The sentiment of the "Non-commercial" group turned "bearish" several months ago, but bulls have regained dominance. The total number of long positions held by speculators is now 182,000, while short positions total 155,000.

I still believe that the situation will continue to shift in favor of the bears. I see no long-term reasons to buy the euro, as the ECB's monetary easing will reduce yields on bank deposits and government bonds. In the U.S., yields are likely to remain high at least until September, making the dollar more attractive to investors. The potential for a euro decline is significant. However, one should not overlook the technical analysis, which currently does not suggest a strong fall for the euro.

News Calendar for the U.S. and Eurozone:

  • Eurozone – Germany Manufacturing PMI (07:30 UTC)
  • Eurozone – Germany Services PMI (07:30 UTC)
  • Eurozone – Manufacturing PMI (08:00 UTC)
  • Eurozone – Services PMI (08:00 UTC)
  • U.S. – Initial Jobless Claims (12:30 UTC)
  • U.S. – Manufacturing PMI (13:45 UTC)
  • U.S. – Services PMI (13:45 UTC)

On August 22, the economic calendar contains a significant number of entries. The impact of the information background on trader sentiment will be notable for the first time this week.

Forecast for EUR/USD and Trading Tips:

Selling the pair today can be considered on a rebound from the 1.1165 level on the hourly chart, targeting 1.1070–1.1081. Purchases were possible upon closing above the 1.1080 level on the hourly chart with a target of 1.1140, which was reached. New long positions can be considered upon the formation of buy signals near the levels of 1.1070–1.1081 or 1.1165 on the hourly chart.

Fibonacci grids are constructed from 1.0917–1.0668 on the hourly chart and from 1.1139–1.0603 on the 4-hour chart.

Seleccione el marco de tiempo
5
min
15
min
30
min
1
hora
4
horas
1
día
1
s.
Gana con los cambios en el valor de las criptomonedas con InstaForex.
Descarga MetaTrader 4 y abre tu primera operación.
  • Grand Choice
    Contest by
    InstaForex
    InstaForex always strives to help you
    fulfill your biggest dreams.
    UNIRSE AL CONCURSO

Recommended Stories

Pronóstico del gas para el 17 de marzo de 2025

Gas natural (NG) La jornada de hoy se abrió por encima de la línea indicadora Kruzenshtern en el marco diario. Al mismo tiempo, el oscilador Marlin cambió de dirección hacia

Laurie Bailey 07:02 2025-03-17 UTC+2

Pronóstico para el Bitcoin el 21 de febrero de 2025

Bitcoin El Bitcoin ha cambiado de opinión sobre el desarrollo de una caída hacia soportes objetivos cómodos, y en su lugar, siguiendo el sentimiento de riesgo general, ha revertido desde

Laurie Bailey 07:23 2025-02-21 UTC+2

Bitcoin - análisis técnico de la situación

Viernes, y el Bitcoin sigue esperando. Ninguna de las partes enfrentadas tiene prisa por presentarse y ser activa. En la incertidumbre actual, el posicionamiento de los principales índices de referencia

Evangelos Poulakis 07:45 2025-02-14 UTC+2

Previsión para el gas natural (GN) del 5 de febrero de 2025

En el gráfico semanal la semana pasada el precio se revirtió desde el nivel de soporte 3.017 - desde los máximos de septiembre 2024, agosto 2023, febrero 2023 y también

Laurie Bailey 07:51 2025-02-05 UTC+2

#NDX - análisis técnico de la situación

A finales del año pasado, el índice marcó un nuevo máximo histórico (22141), tras lo cual se detuvo la subida, comenzó la formación de la corrección y la consolidación. Ahora

Evangelos Poulakis 07:24 2025-02-04 UTC+2

Bitcoin 30 Enero - análisis técnico de la situación

A pesar de marcar un nuevo máximo la semana pasada (109986), el Bitcoin detuvo su tendencia alcista y comenzó a formar incertidumbre. Hasta ahora, el formato semanal ha proyectado

Evangelos Poulakis 07:24 2025-01-30 UTC+2

#SPX (contrato CFD sobre futuros del SP500). Esperamos que la subida continúe

El contrato CFD sobre futuros del S&P 500 se recupera vigorosamente tras una caída local del lunes por la oleada de noticias sobre el éxito de la empresa china DeepSeek

Pati Gani 11:06 2025-01-29 UTC+2

Nasdaq 100. Se esperan nuevos máximos históricos

La toma de posesión hoy de Donald Trump marcará el inicio del segundo mandato de su presidencia, acompañado de promesas de reforzar la posición de EE. UU. en la escena

Anna Zotova 10:00 2025-01-20 UTC+2

Bitcoin – análisis técnico de la situación

El año pasado los principales logros y ventajas estuvieron del lado de los compradores. El año 2024 les trajo un nuevo máximo histórico (108362,36), superando el máximo anterior registrado

Evangelos Poulakis 06:55 2025-01-20 UTC+2

Análisis técnico para la semana del 16 al 21 de diciembre, del par de divisas GBP/USD.

La semana pasada, el par, moviéndose hacia abajo, rompió el nivel de retroceso del 14,6% – 1,2624 (línea de puntos azul), cerrando la vela semanal en 1,2618. Durante la próxima

Stefan Doll 09:17 2024-12-16 UTC+2
¿No puede hablar ahora mismo?
Ingrese su pregunta en el chat.
Widget callback
 

Dear visitor,

Your IP address shows that you are currently located in the USA. If you are a resident of the United States, you are prohibited from using the services of InstaFintech Group including online trading, online transfers, deposit/withdrawal of funds, etc.

If you think you are seeing this message by mistake and your location is not the US, kindly proceed to the website. Otherwise, you must leave the website in order to comply with government restrictions.

Why does your IP address show your location as the USA?

  • - you are using a VPN provided by a hosting company based in the United States;
  • - your IP does not have proper WHOIS records;
  • - an error occurred in the WHOIS geolocation database.

Please confirm whether you are a US resident or not by clicking the relevant button below. If you choose the wrong option, being a US resident, you will not be able to open an account with InstaForex anyway.

We are sorry for any inconvenience caused by this message.