


signal strength 1 of 5
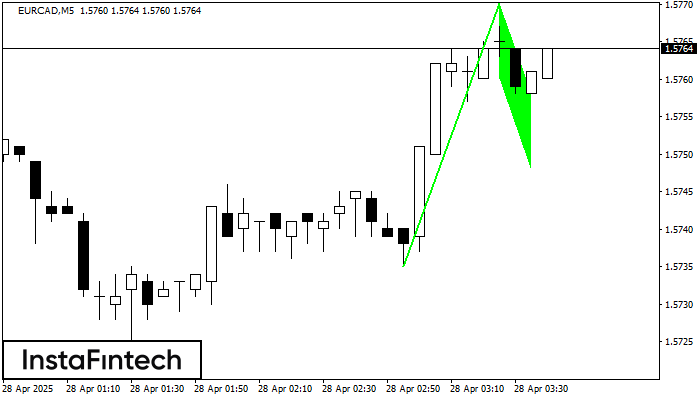
The Bullish Flag pattern has been formed on the chart EURCAD M5 which signals that the upward trend will continue. Signals: а break of the peak at 1.5770 may push the price higher, and the rise will be the projection of the pole.
The M5 and M15 time frames may have more false entry points.
- All
- Double Top
- Flag
- Head and Shoulders
- Pennant
- Rectangle
- Triangle
- Triple top
- All
- #AAPL
- #AMZN
- #Bitcoin
- #EBAY
- #FB
- #GOOG
- #INTC
- #KO
- #MA
- #MCD
- #MSFT
- #NTDOY
- #PEP
- #TSLA
- #TWTR
- AUDCAD
- AUDCHF
- AUDJPY
- AUDUSD
- EURCAD
- EURCHF
- EURGBP
- EURJPY
- EURNZD
- EURRUB
- EURUSD
- GBPAUD
- GBPCHF
- GBPJPY
- GBPUSD
- GOLD
- NZDCAD
- NZDCHF
- NZDJPY
- NZDUSD
- SILVER
- USDCAD
- USDCHF
- USDJPY
- USDRUB
- All
- M5
- M15
- M30
- H1
- D1
- All
- Buy
- Sale
- All
- 1
- 2
- 3
- 4
- 5
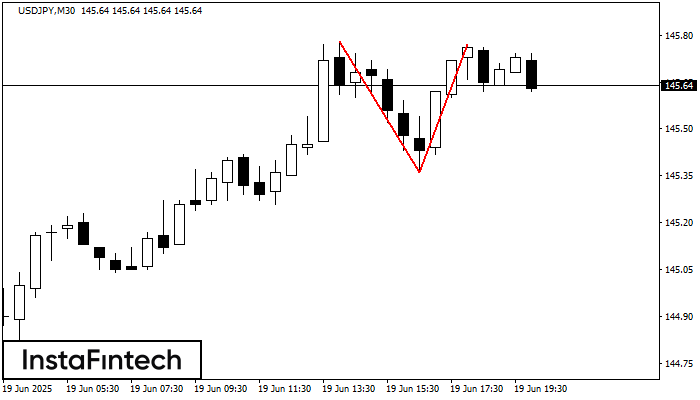
En el gráfico de USDJPY M30 el patrón de reversión Doble Techo ha sido formado. Características: límite superior 145.77; límite inferior 145.36; el ancho del patrón 41 puntos. La señal
Open chart in a new window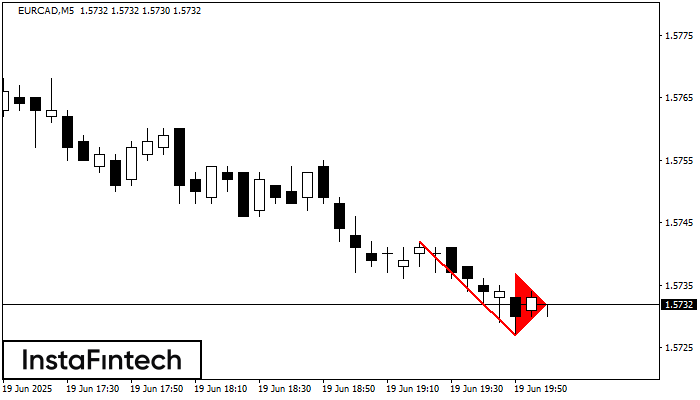
El patrón Banderín bajista se ha formado en el gráfico EURCAD M5. Esto señala la continuación potencial de la tendencia existente. Especificaciones: el piso del patrón tiene la coordinada
Los marcos de tiempo M5 y M15 pueden tener más puntos de entrada falsos.
Open chart in a new window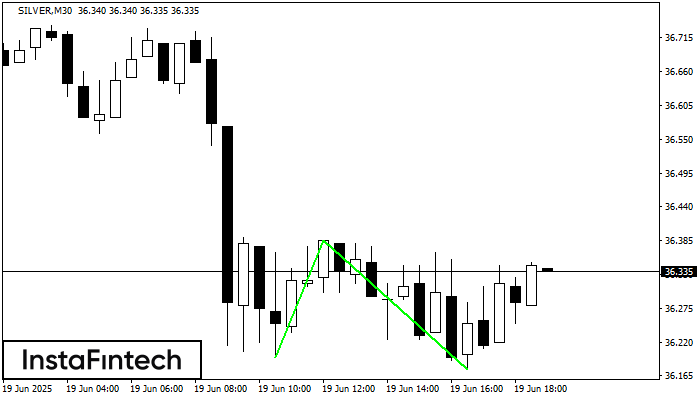
El patrón Doble Piso ha sido formado en SILVER M30. Características: el nivel de soporte 36.20; el nivel de resistencia 36.38; el ancho del patrón 190 puntos. Si el nivel
Open chart in a new window


