


signal strength 1 of 5

On the chart of the #Bitcoin M5 trading instrument, the Triple Top pattern that signals a trend change has formed. It is possible that after formation of the third peak, the price will try to break through the resistance level 82818.73, where we advise to open a trading position for sale. Take profit is the projection of the pattern’s width, which is 46117 points.
The M5 and M15 time frames may have more false entry points.
See Also
- All
- Double Top
- Flag
- Head and Shoulders
- Pennant
- Rectangle
- Triangle
- Triple top
- All
- #AAPL
- #AMZN
- #Bitcoin
- #EBAY
- #FB
- #GOOG
- #INTC
- #KO
- #MA
- #MCD
- #MSFT
- #NTDOY
- #PEP
- #TSLA
- #TWTR
- AUDCAD
- AUDCHF
- AUDJPY
- AUDUSD
- EURCAD
- EURCHF
- EURGBP
- EURJPY
- EURNZD
- EURRUB
- EURUSD
- GBPAUD
- GBPCHF
- GBPJPY
- GBPUSD
- GOLD
- NZDCAD
- NZDCHF
- NZDJPY
- NZDUSD
- SILVER
- USDCAD
- USDCHF
- USDJPY
- USDRUB
- All
- M5
- M15
- M30
- H1
- D1
- All
- Buy
- Sale
- All
- 1
- 2
- 3
- 4
- 5

En el gráfico del instrumento de negociación NZDUSD M5, se ha formado el patrón Triple Techo que señala un cambio en la tendencia. Es posible que después de la formación
Los marcos de tiempo M5 y M15 pueden tener más puntos de entrada falsos.
Open chart in a new window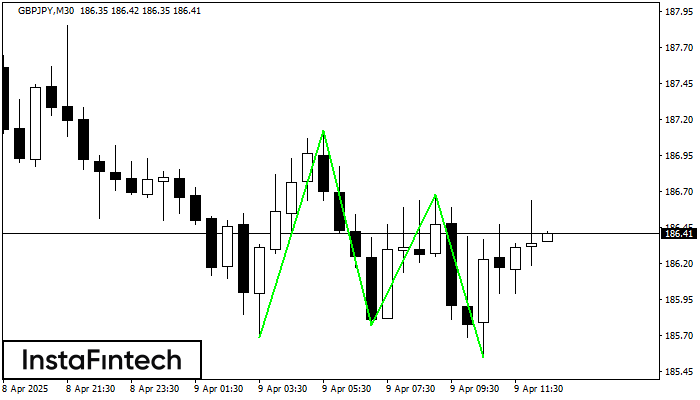
El patrón Triple Piso ha sido formado en el gráfico de GBPJPY M30. Características del patrón: línea inferior del patrón tiene coordenadas 187.12 con el límite superior 187.12/186.68, la proyección
Open chart in a new window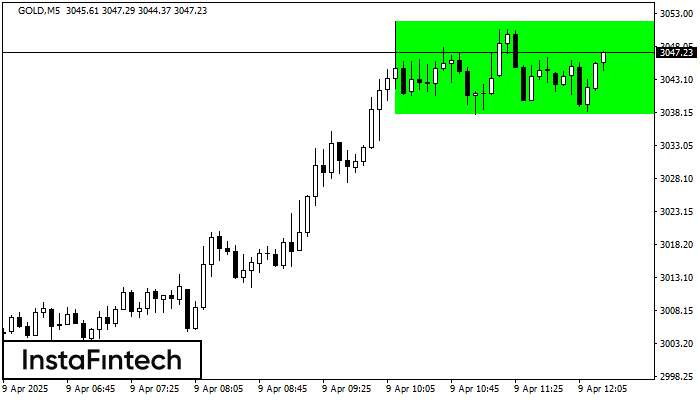
Según el gráfico de M5, GOLD formó el Rectángulo Alcista. Este tipo de patrón indica la continuación de una tendencia. Esto consiste de dos niveles: resistencia 3051.82 y soporte 3037.74
Los marcos de tiempo M5 y M15 pueden tener más puntos de entrada falsos.
Open chart in a new window


