

signal strength 1 of 5
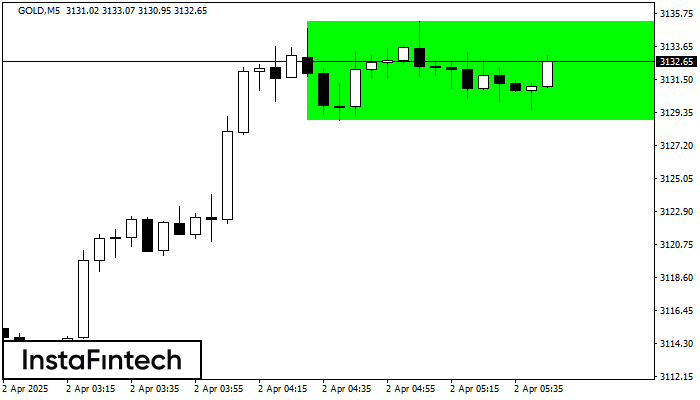
According to the chart of M5, GOLD formed the Bullish Rectangle which is a pattern of a trend continuation. The pattern is contained within the following borders: the lower border 3128.79 – 3128.79 and upper border 3135.25 – 3135.25. In case the upper border is broken, the instrument is likely to follow the upward trend.
The M5 and M15 time frames may have more false entry points.
See Also
- All
- Double Top
- Flag
- Head and Shoulders
- Pennant
- Rectangle
- Triangle
- Triple top
- All
- #AAPL
- #AMZN
- #Bitcoin
- #EBAY
- #FB
- #GOOG
- #INTC
- #KO
- #MA
- #MCD
- #MSFT
- #NTDOY
- #PEP
- #TSLA
- #TWTR
- AUDCAD
- AUDCHF
- AUDJPY
- AUDUSD
- EURCAD
- EURCHF
- EURGBP
- EURJPY
- EURNZD
- EURRUB
- EURUSD
- GBPAUD
- GBPCHF
- GBPJPY
- GBPUSD
- GOLD
- NZDCAD
- NZDCHF
- NZDJPY
- NZDUSD
- SILVER
- USDCAD
- USDCHF
- USDJPY
- USDRUB
- All
- M5
- M15
- M30
- H1
- D1
- All
- Buy
- Sale
- All
- 1
- 2
- 3
- 4
- 5
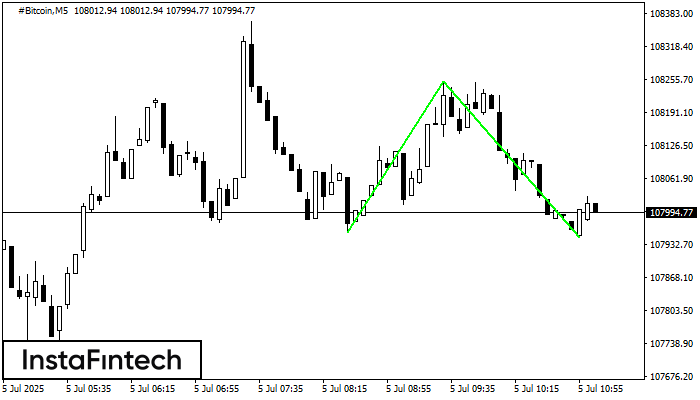
Mô hình Đáy đôi đã được hình thành trên #Bitcoin M5. Đặc điểm: mức hỗ trợ 107955.72; mức kháng cự 108251.09; chiều rộng của mô hình 29537 điểm
Khung thời gian M5 và M15 có thể có nhiều điểm vào lệnh sai hơn.
Open chart in a new window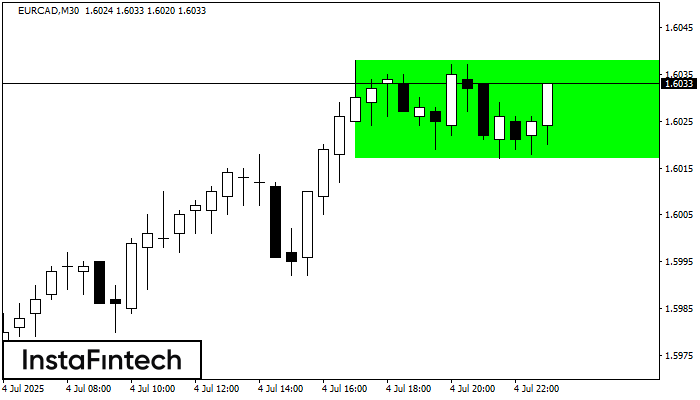
Theo biểu đồ của M30, EURCAD đã hình thành Hình chữ nhật tăng, cái mà là mô hình của sự tiếp tục xu hướng. Mô hình này được chứa trong
Open chart in a new window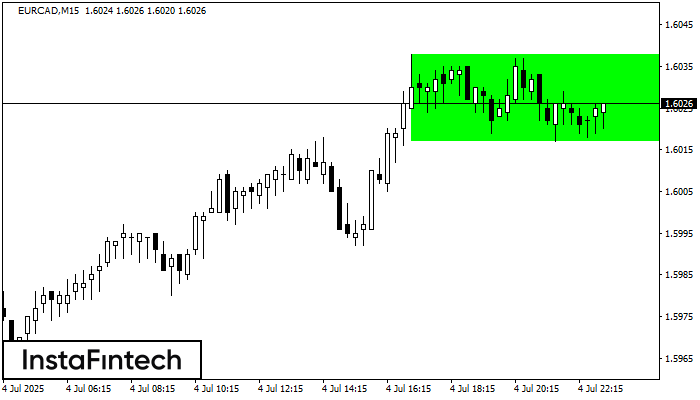
Theo biểu đồ của M15, EURCAD đã hình thành Hình chữ nhật tăng, cái mà là mô hình của sự tiếp tục xu hướng. Mô hình này được chứa trong
Khung thời gian M5 và M15 có thể có nhiều điểm vào lệnh sai hơn.
Open chart in a new window


