

signal strength 1 of 5

According to the chart of M5, USDJPY formed the Head and Shoulders pattern. The Head’s top is set at 150.87 while the median line of the Neck is found at 150.68/150.70. The formation of the Head and Shoulders pattern evidently signals a reversal of the upward trend. In other words, in case the scenario comes true, the price of USDJPY will go towards 150.55.
The M5 and M15 time frames may have more false entry points.
- All
- Double Top
- Flag
- Head and Shoulders
- Pennant
- Rectangle
- Triangle
- Triple top
- All
- #AAPL
- #AMZN
- #Bitcoin
- #EBAY
- #FB
- #GOOG
- #INTC
- #KO
- #MA
- #MCD
- #MSFT
- #NTDOY
- #PEP
- #TSLA
- #TWTR
- AUDCAD
- AUDCHF
- AUDJPY
- AUDUSD
- EURCAD
- EURCHF
- EURGBP
- EURJPY
- EURNZD
- EURRUB
- EURUSD
- GBPAUD
- GBPCHF
- GBPJPY
- GBPUSD
- GOLD
- NZDCAD
- NZDCHF
- NZDJPY
- NZDUSD
- SILVER
- USDCAD
- USDCHF
- USDJPY
- USDRUB
- All
- M5
- M15
- M30
- H1
- D1
- All
- Buy
- Sale
- All
- 1
- 2
- 3
- 4
- 5
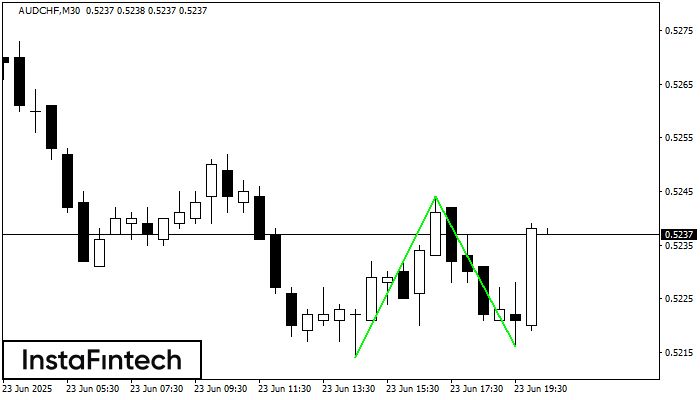
Сформирована фигура «Двойное дно» на графике AUDCHF M30. Характеристика: Уровень поддержки 0.5214; Уровень сопротивления 0.5244; Ширина фигуры 30 пунктов. В случае пробоя уровня сопротивления можно будет прогнозировать изменение тенденции
Открыть график инструмента в новом окне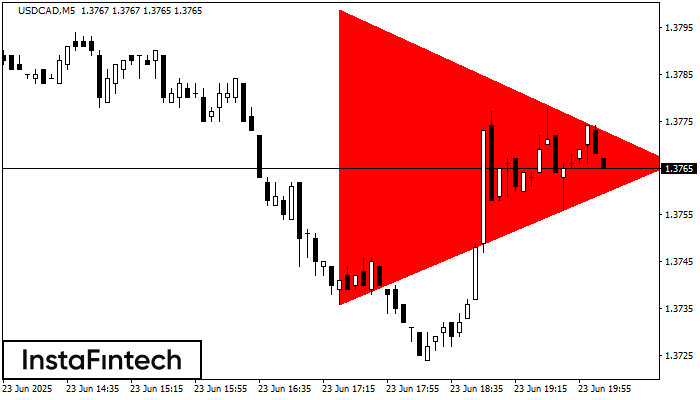
На графике USDCAD M5 сформировалась фигура «Медвежий симметричный треугольник». Характеристика фигуры: Нижняя граница 1.3736/1.3766; Верхняя граница 1.3799/1.3766; Проекция ширины фигуры -63 пунктов. Формирование фигуры «Медвежий симметричный треугольник» наиболее вероятным образом
Таймфреймы М5 и М15 могут иметь больше ложных точек входа.
Открыть график инструмента в новом окне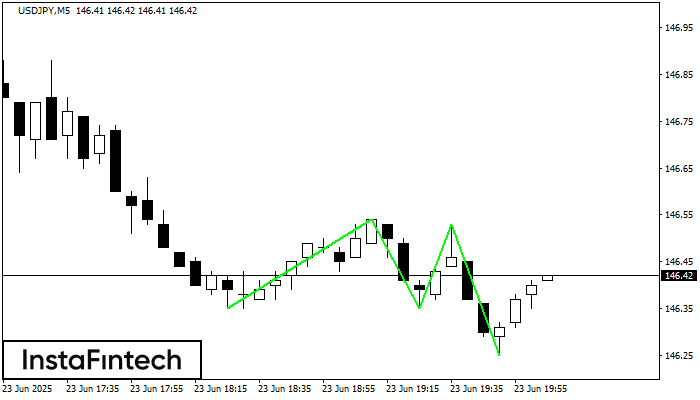
По торговому инструменту USDJPY на M5 была сформирована графическая фигура «Тройное дно» с характеристиками: Уровень сопротивления 146.53; Уровень поддержки 146.25; Ширина 28 пунктов. В случае пробоя уровня сопротивления 146.54 котировка
Таймфреймы М5 и М15 могут иметь больше ложных точек входа.
Открыть график инструмента в новом окне


