

signal strength 2 of 5
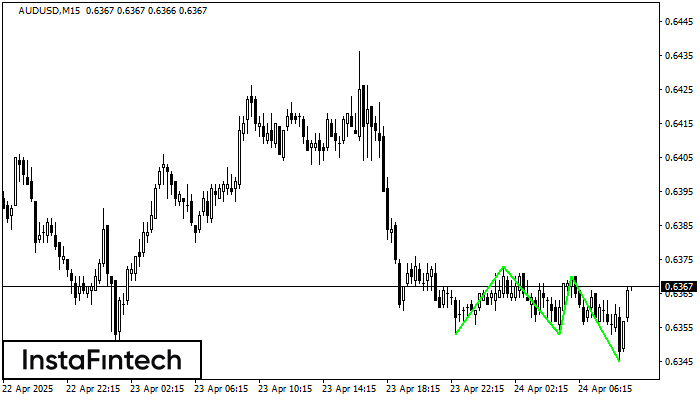
The Triple Bottom pattern has been formed on AUDUSD M15. It has the following characteristics: resistance level 0.6373/0.6370; support level 0.6353/0.6345; the width is 20 points. In the event of a breakdown of the resistance level of 0.6373, the price is likely to continue an upward movement at least to 0.6375.
The M5 and M15 time frames may have more false entry points.
- All
- Double Top
- Flag
- Head and Shoulders
- Pennant
- Rectangle
- Triangle
- Triple top
- All
- #AAPL
- #AMZN
- #Bitcoin
- #EBAY
- #FB
- #GOOG
- #INTC
- #KO
- #MA
- #MCD
- #MSFT
- #NTDOY
- #PEP
- #TSLA
- #TWTR
- AUDCAD
- AUDCHF
- AUDJPY
- AUDUSD
- EURCAD
- EURCHF
- EURGBP
- EURJPY
- EURNZD
- EURRUB
- EURUSD
- GBPAUD
- GBPCHF
- GBPJPY
- GBPUSD
- GOLD
- NZDCAD
- NZDCHF
- NZDJPY
- NZDUSD
- SILVER
- USDCAD
- USDCHF
- USDJPY
- USDRUB
- All
- M5
- M15
- M30
- H1
- D1
- All
- Buy
- Sale
- All
- 1
- 2
- 3
- 4
- 5
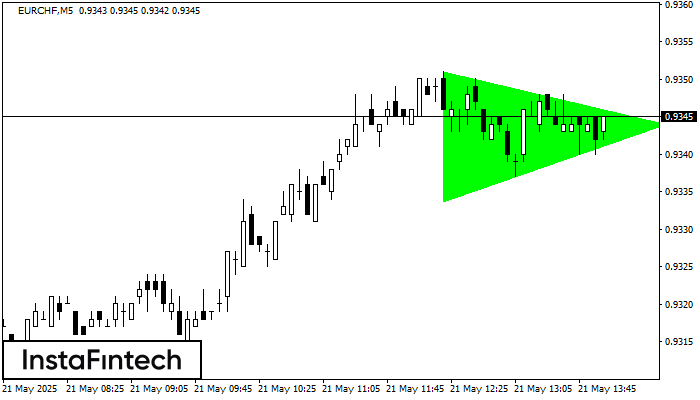
According to the chart of M5, EURCHF formed the Bullish Symmetrical Triangle pattern. The lower border of the pattern touches the coordinates 0.9334/0.9344 whereas the upper border goes across 0.9351/0.9344
The M5 and M15 time frames may have more false entry points.
Open chart in a new window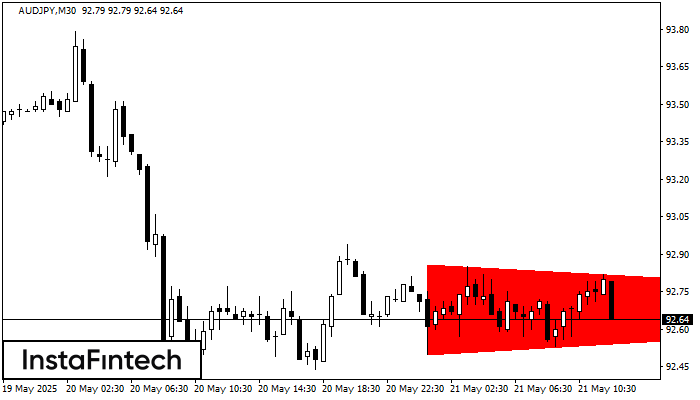
According to the chart of M30, AUDJPY formed the Bearish Symmetrical Triangle pattern. This pattern signals a further downward trend in case the lower border 92.50 is breached. Here
Open chart in a new window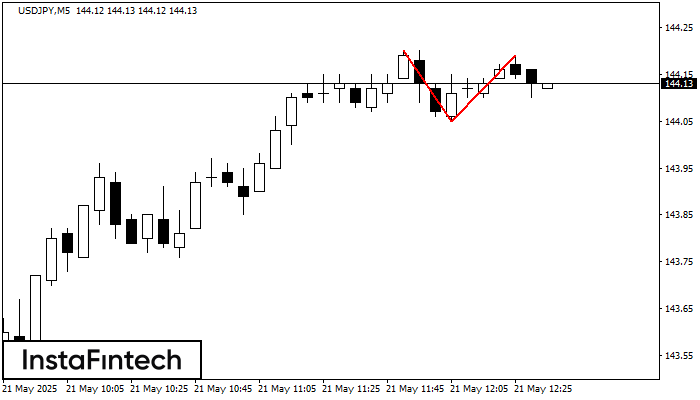
On the chart of USDJPY M5 the Double Top reversal pattern has been formed. Characteristics: the upper boundary 144.19; the lower boundary 144.05; the width of the pattern 14 points
The M5 and M15 time frames may have more false entry points.
Open chart in a new window


