


signal strength 1 of 5

According to the chart of M5, NZDJPY formed the Bearish Symmetrical Triangle pattern. Description: The lower border is 84.16/84.34 and upper border is 84.51/84.34. The pattern width is measured on the chart at -35 pips. The formation of the Bearish Symmetrical Triangle pattern evidently signals a continuation of the downward trend. In other words, if the scenario comes true and NZDJPY breaches the lower border, the price could continue its move toward 84.19.
The M5 and M15 time frames may have more false entry points.
- All
- Double Top
- Flag
- Head and Shoulders
- Pennant
- Rectangle
- Triangle
- Triple top
- All
- #AAPL
- #AMZN
- #Bitcoin
- #EBAY
- #FB
- #GOOG
- #INTC
- #KO
- #MA
- #MCD
- #MSFT
- #NTDOY
- #PEP
- #TSLA
- #TWTR
- AUDCAD
- AUDCHF
- AUDJPY
- AUDUSD
- EURCAD
- EURCHF
- EURGBP
- EURJPY
- EURNZD
- EURRUB
- EURUSD
- GBPAUD
- GBPCHF
- GBPJPY
- GBPUSD
- GOLD
- NZDCAD
- NZDCHF
- NZDJPY
- NZDUSD
- SILVER
- USDCAD
- USDCHF
- USDJPY
- USDRUB
- All
- M5
- M15
- M30
- H1
- D1
- All
- Buy
- Sale
- All
- 1
- 2
- 3
- 4
- 5
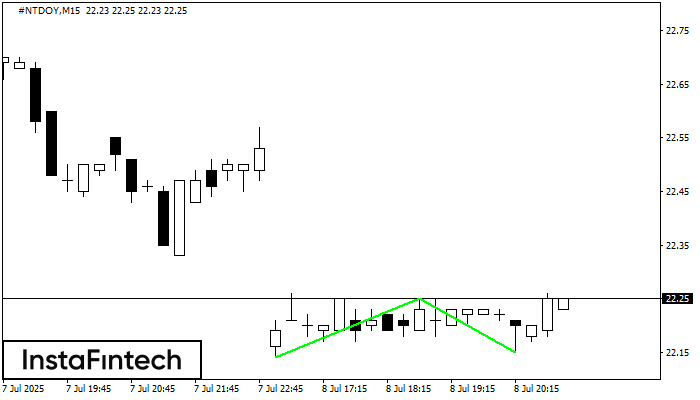
O padrão Fundo duplo foi formado em #NTDOY M15. Características: o nível de suporte 22.14; o nível de resistência 22.25; a largura do padrão 11 pontos. Se o nível
Os intervalos M5 e M15 podem ter mais pontos de entrada falsos.
Open chart in a new window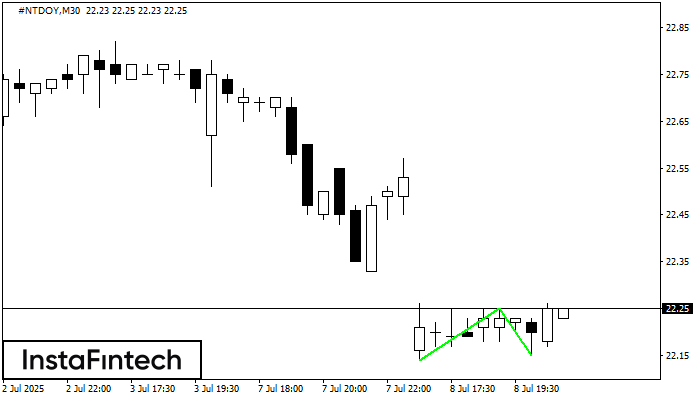
O padrão Fundo duplo foi formado em #NTDOY M30. Características: o nível de suporte 22.14; o nível de resistência 22.25; a largura do padrão 11 pontos. Se o nível
Open chart in a new window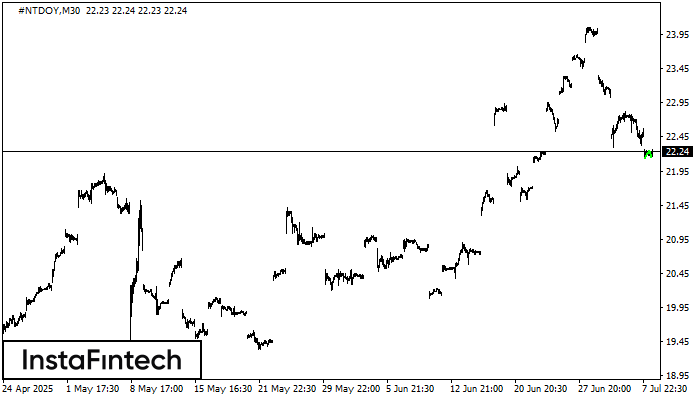
O padrão Fundo duplo foi formado em #NTDOY M30. Características: o nível de suporte 22.14; o nível de resistência 22.25; a largura do padrão 11 pontos. Se o nível
Open chart in a new window


