

signal strength 1 of 5
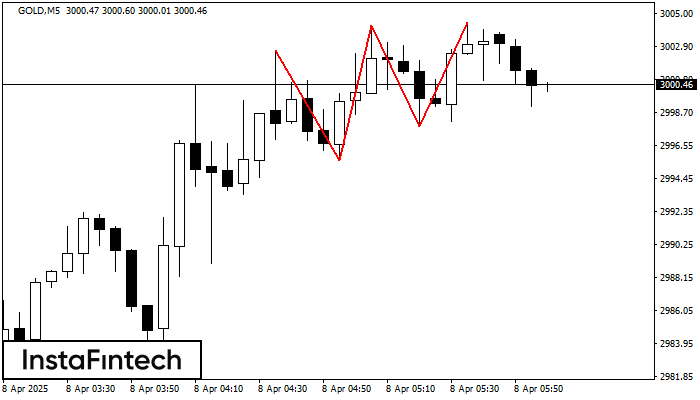
On the chart of the GOLD M5 trading instrument, the Triple Top pattern that signals a trend change has formed. It is possible that after formation of the third peak, the price will try to break through the resistance level 2995.63, where we advise to open a trading position for sale. Take profit is the projection of the pattern’s width, which is 701 points.
The M5 and M15 time frames may have more false entry points.
Veja também
- All
- Double Top
- Flag
- Head and Shoulders
- Pennant
- Rectangle
- Triangle
- Triple top
- All
- #AAPL
- #AMZN
- #Bitcoin
- #EBAY
- #FB
- #GOOG
- #INTC
- #KO
- #MA
- #MCD
- #MSFT
- #NTDOY
- #PEP
- #TSLA
- #TWTR
- AUDCAD
- AUDCHF
- AUDJPY
- AUDUSD
- EURCAD
- EURCHF
- EURGBP
- EURJPY
- EURNZD
- EURRUB
- EURUSD
- GBPAUD
- GBPCHF
- GBPJPY
- GBPUSD
- GOLD
- NZDCAD
- NZDCHF
- NZDJPY
- NZDUSD
- SILVER
- USDCAD
- USDCHF
- USDJPY
- USDRUB
- All
- M5
- M15
- M30
- H1
- D1
- All
- Buy
- Sale
- All
- 1
- 2
- 3
- 4
- 5
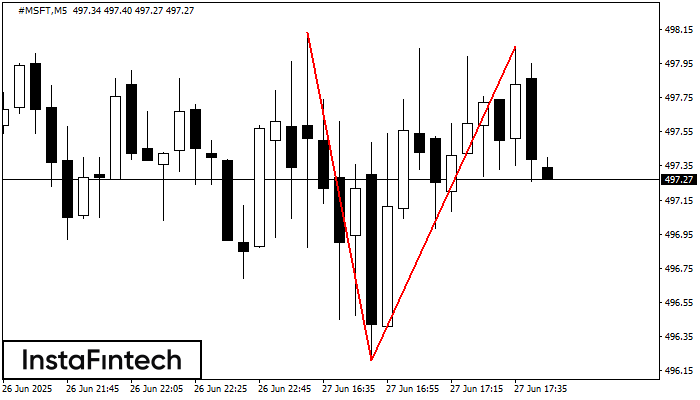
No gráfico de #MSFT M5 o padrão de reversão Topo duplo foi formado. Características: o limite superior 498.05; o limite inferior 496.21; a largura do padrão 184 pontos. O sinal
Os intervalos M5 e M15 podem ter mais pontos de entrada falsos.
Open chart in a new window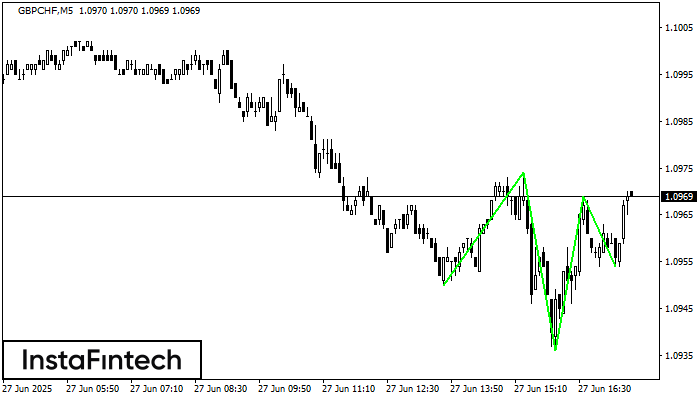
De acordo com o gráfico de M5, GBPCHF formou o padrão Cabeça & Ombro Invertidos. O topo da Cabeça é definido em 1.0969 enquanto a linha mediana do Pescoço
Os intervalos M5 e M15 podem ter mais pontos de entrada falsos.
Open chart in a new window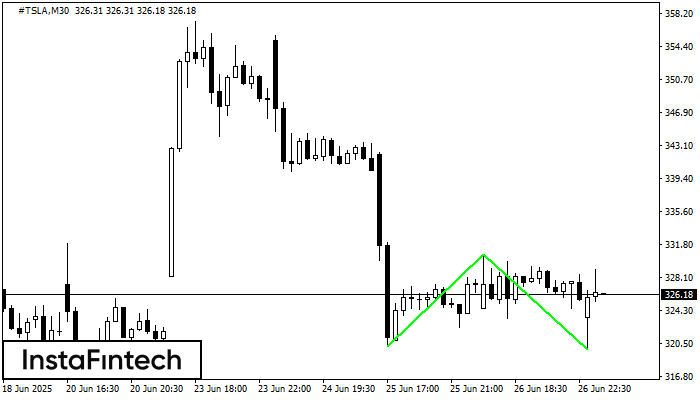
O padrão Fundo duplo foi formado em #TSLA M30; o limite superior é 330.73; o limite inferior é 319.85. A largura do padrão é de 1057 pontos. No caso
Open chart in a new window


