

signal strength 1 of 5

The Triple Bottom pattern has been formed on EURUSD M5. It has the following characteristics: resistance level 1.0936/1.0923; support level 1.0906/1.0904; the width is 30 points. In the event of a breakdown of the resistance level of 1.0936, the price is likely to continue an upward movement at least to 1.0916.
The M5 and M15 time frames may have more false entry points.
- All
- Double Top
- Flag
- Head and Shoulders
- Pennant
- Rectangle
- Triangle
- Triple top
- All
- #AAPL
- #AMZN
- #Bitcoin
- #EBAY
- #FB
- #GOOG
- #INTC
- #KO
- #MA
- #MCD
- #MSFT
- #NTDOY
- #PEP
- #TSLA
- #TWTR
- AUDCAD
- AUDCHF
- AUDJPY
- AUDUSD
- EURCAD
- EURCHF
- EURGBP
- EURJPY
- EURNZD
- EURRUB
- EURUSD
- GBPAUD
- GBPCHF
- GBPJPY
- GBPUSD
- GOLD
- NZDCAD
- NZDCHF
- NZDJPY
- NZDUSD
- SILVER
- USDCAD
- USDCHF
- USDJPY
- USDRUB
- All
- M5
- M15
- M30
- H1
- D1
- All
- Buy
- Sale
- All
- 1
- 2
- 3
- 4
- 5
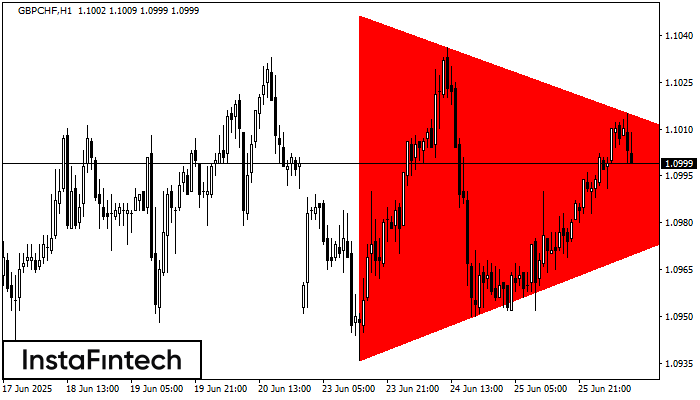
De acordo com o gráfico de H1, GBPCHF formou o padrão Triângulo Simétrico de Baixa. Descrição: o limite inferior é 1.0936/1.0993 e o limite superior é 1.1046/1.0993. A largura
Open chart in a new window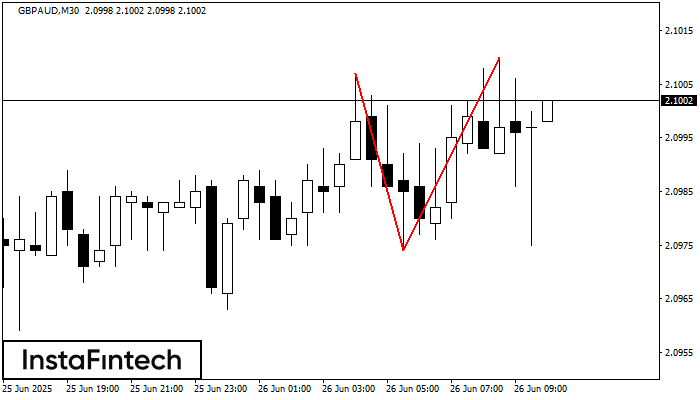
No gráfico de GBPAUD M30 o padrão de reversão Topo duplo foi formado. Características: o limite superior 2.1010; o limite inferior 2.0974; a largura do padrão 36 pontos. O sinal
Open chart in a new window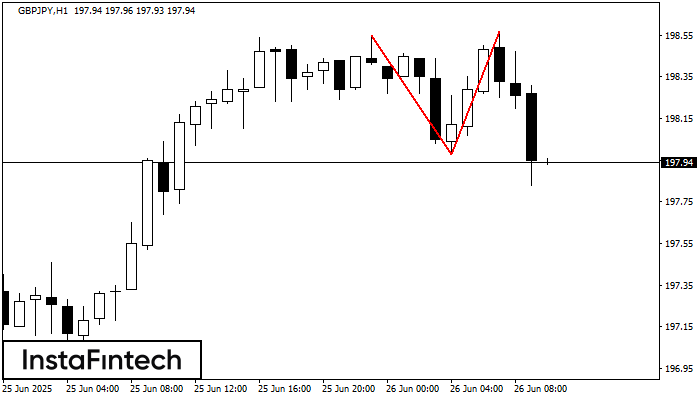
O padrão Topo duplo foi formado em GBPJPY H1. Isso sinaliza que a tendência foi alterada de cima para baixo. Provavelmente, se a base do padrão 197.98 for quebrada
Open chart in a new window


