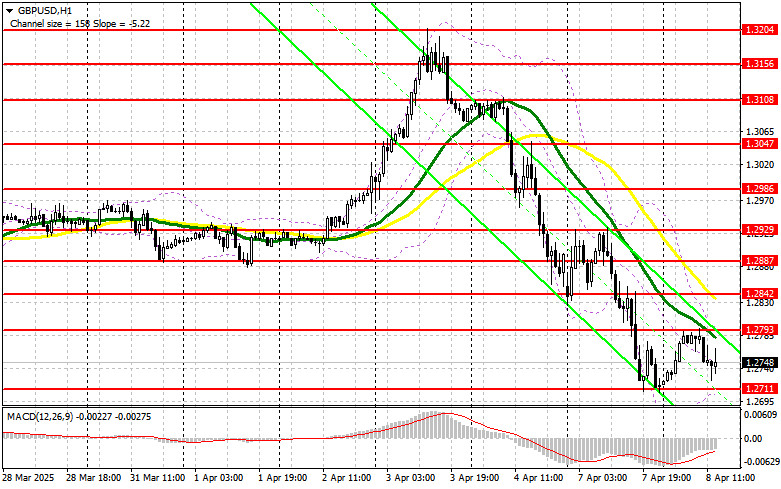
In my morning forecast, I focused on the 1.2754 level and planned to make trading decisions from it. Let's look at the 5-minute chart and examine what happened there. A decline and a false breakout at that level provided an entry point for buying the pound, but the pair rose only 15 points before selling pressure resumed. The technical picture was revised for the second half of the day.
To open long positions on GBP/USD:
Sellers acted a bit earlier than I expected, so I missed the morning short from the 1.2800 level. Now traders should focus on US data. Figures on the NFIB Small Business Optimism Index in the US and a speech by FOMC member Mary Daly are expected. Most likely, neither event will provoke a strong market reaction, so it's better to stick with trend-based trading, continuing to sell the pound. As for buying, the recent price action shows there is no need to rush. In the case of a further decline, I prefer to act near the support at 1.2711, which marks the weekly low. A false breakout there, similar to the one discussed above, will provide a good entry point for long positions, targeting a recovery to the 1.2793 resistance level. A breakout and retest from top to bottom of this range will offer a new entry into long positions with the prospect of reaching 1.2842. The ultimate target will be the area around 1.2887, where I plan to take profit. A test of this level will halt the bearish market development. If GBP/USD drops and bulls are inactive around 1.2711 in the second half of the day, the outlook for buyers will worsen, and pressure on the pound will intensify. In that case, only a false breakout around 1.2679 would be a valid signal for opening long positions. I plan to buy GBP/USD on a direct rebound only from the 1.2646 support area, targeting an intraday correction of 30–35 points.
To open short positions on GBP/USD:
Pound sellers made their presence known in the first half of the day even in the absence of any important UK data. Most likely, comments from Bank of England officials negatively affected market sentiment. If GBP/USD rises during the US session following FOMC comments, a false breakout around 1.2793 will provide an entry point for selling, targeting a continuation of the bearish trend and a decline toward the 1.2711 support. A breakout and retest of this range from the bottom up will trigger stop-losses and open the way to 1.2679, which will significantly hurt pound buyers. The ultimate target will be the 1.2646 level, where I plan to take profit. If demand for the pound returns in the second half of the day and bears show no activity around 1.2793, it's better to postpone short positions until a test of the 1.2842 resistance, where the moving averages are located and are currently working in favor of sellers. I will sell only after a false breakout at this level. If there is no downward movement there either, I will look for short entries on a rebound from 1.2887, targeting a 30–35 point intraday correction.
COT Report (Commitment of Traders) as of April 1:
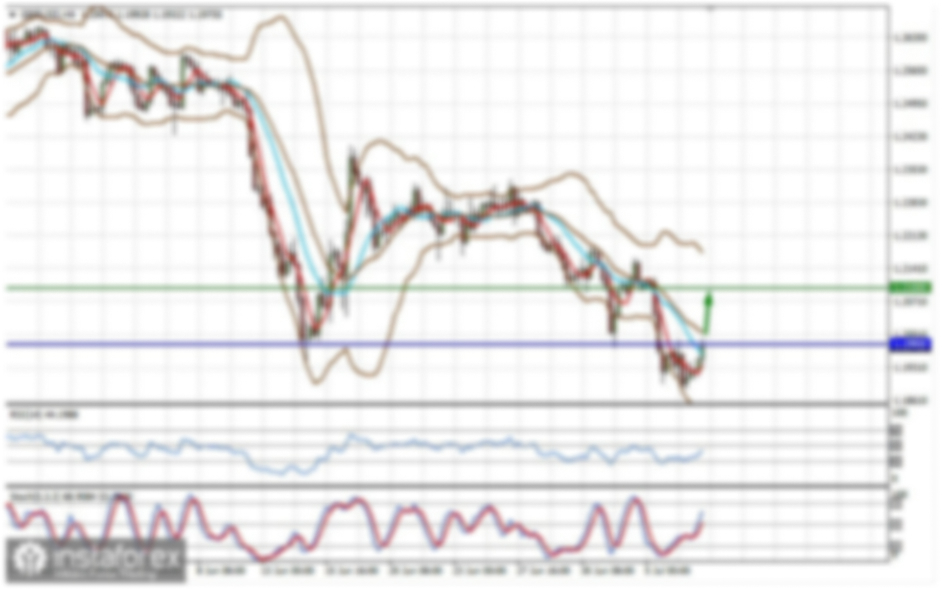
There was a slight increase in short positions and a decrease in long ones. It is important to note that this report does not reflect the latest US trade tariffs introduced against key economic partners, including the UK, nor the most recent US employment data for March. Therefore, a deep analysis of the changes in these figures is not meaningful, as they do not reflect the current market reality. According to the latest COT report, long non-commercial positions dropped by 4,030 to 104,986, while short non-commercial positions rose by 5,627 to 64,733. As a result, the gap between long and short positions increased by 479.
Indicator signals:
Moving averages Trading is taking place below the 30- and 50-period moving averages, indicating the pair is in a downtrend.
Note: The period and prices of moving averages are considered by the author on the H1 hourly chart and differ from the standard definition of classical daily moving averages on the D1 chart.
Bollinger Bands In the event of a decline, the lower boundary of the indicator around 1.2711 will act as support.
Indicator descriptions: • Moving average – determines the current trend by smoothing out volatility and noise. Period – 50 (marked in yellow on the chart); • Moving average – period – 30 (marked in green on the chart); • MACD (Moving Average Convergence/Divergence) – fast EMA: period 12, slow EMA: period 26, SMA: period 9; • Bollinger Bands – period 20; • Non-commercial traders – speculators such as individual traders, hedge funds, and large institutions who use the futures market for speculative purposes and meet specific criteria; • Long non-commercial positions – the total long open positions held by non-commercial traders; • Short non-commercial positions – the total short open positions held by non-commercial traders; • Net non-commercial position – the difference between short and long positions of non-commercial traders.