empty
21.03.2025 07:25 AM
EUR/USD and GBP/USD March 21 – Technical Analysis

EUR/USD

This image is no longer relevant

Higher Timeframes

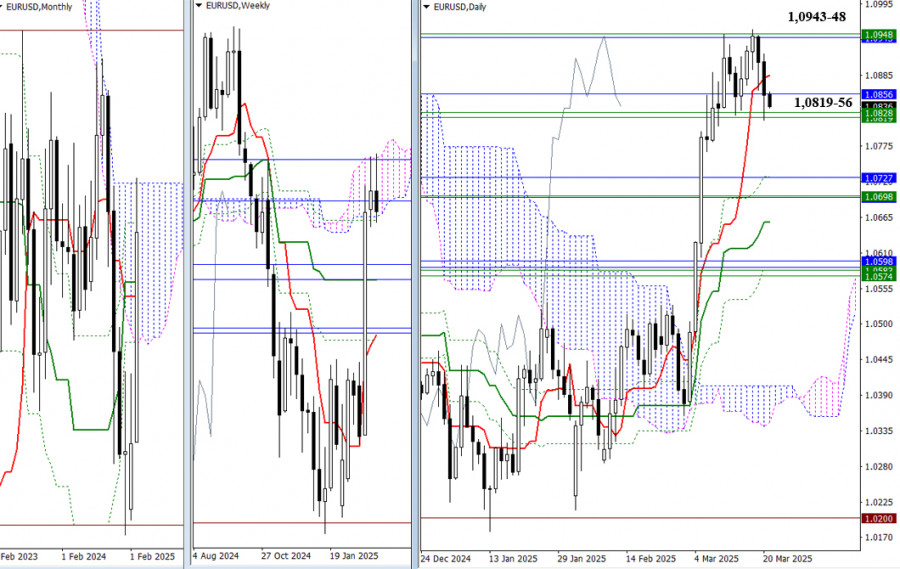
The pair failed to break through the resistance levels of the weekly (1.0948) and monthly (1.0943) Ichimoku clouds, retreating to the support cluster zone across multiple timeframes (1.0819–1.0856). As we wrap up the trading week today, a break and consolidation below this support zone would form a rejection signal on the weekly timeframe. In that case, the bears' next steps would involve confirming and extending the downward movement, with the following support levels in the 1.0696–1.0727 range. If the pair fails to move below 1.0819–1.0856, a pause or consolidation is likely. After that, the market may once again test the Ichimoku cloud boundaries (1.0948–1.0943) in an attempt to break into and stay in bullish territory.

This image is no longer relevant

H4 – H1

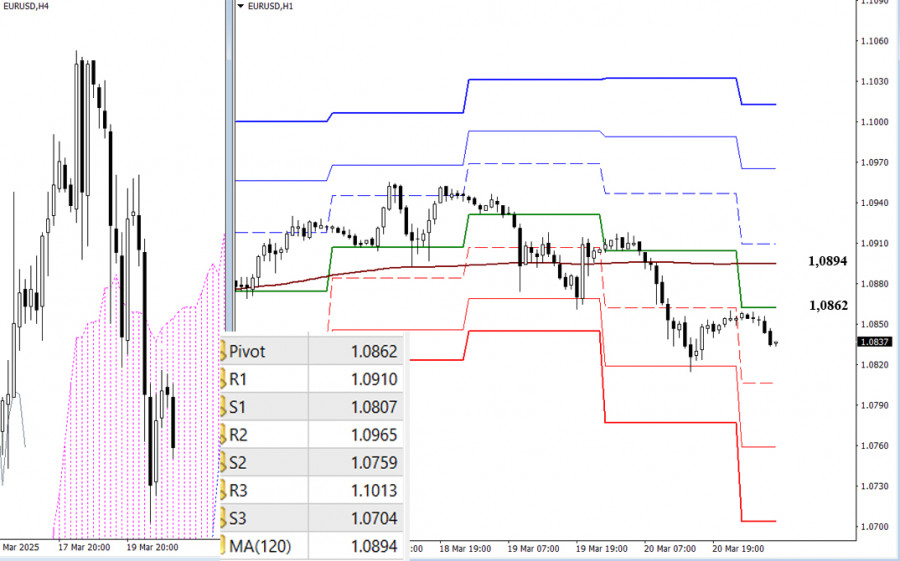
On the lower timeframes, bears have the upper hand. Today's potential for further downside lies through the classic Pivot support levels: 1.0807 – 1.0759 – 1.0704.

Key levels whose breakout could shift the current balance of power are:

  • 1.0862 (daily central Pivot level)
  • 1.0894 (weekly long-term trend level)

If bullish momentum returns, a break above the weekly trend line will reverse its slope. The next upside targets for bulls would be the classic Pivot resistance levels: 1.0910 – 1.0965 – 1.1013.

***

GBP/USD

This image is no longer relevant

Higher Timeframes

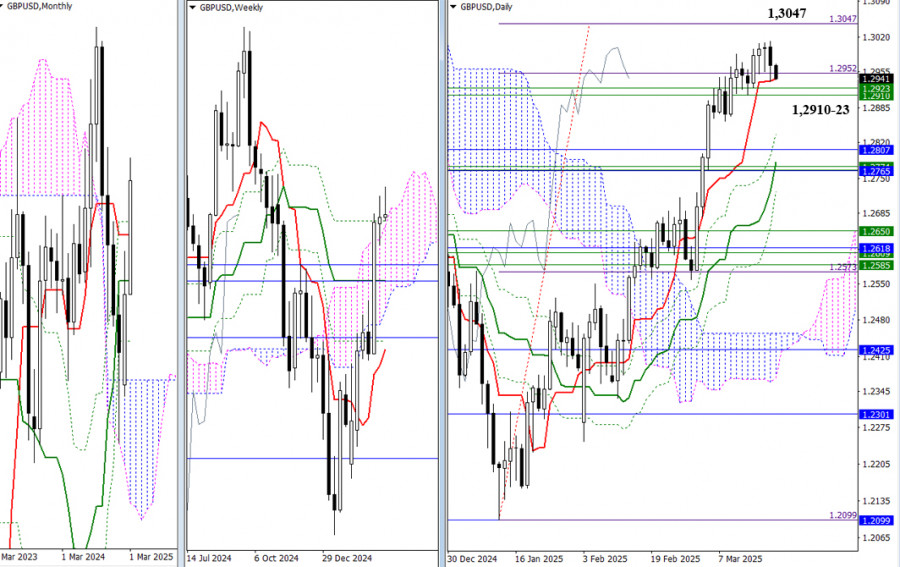
Throughout the current week, bulls managed to update last week's high but achieved no further progress. Instead, they are entering a consolidation phase, using the daily short-term trend line at 1.2941 as support. As a result, previous conclusions and expectations remain valid. The key target for bulls continues to be the 100% Fibonacci projection level at 1.3047, while the nearest bearish plan involves a break below the weekly support levels at 1.2910–1.2923.

This image is no longer relevant

H4 – H1

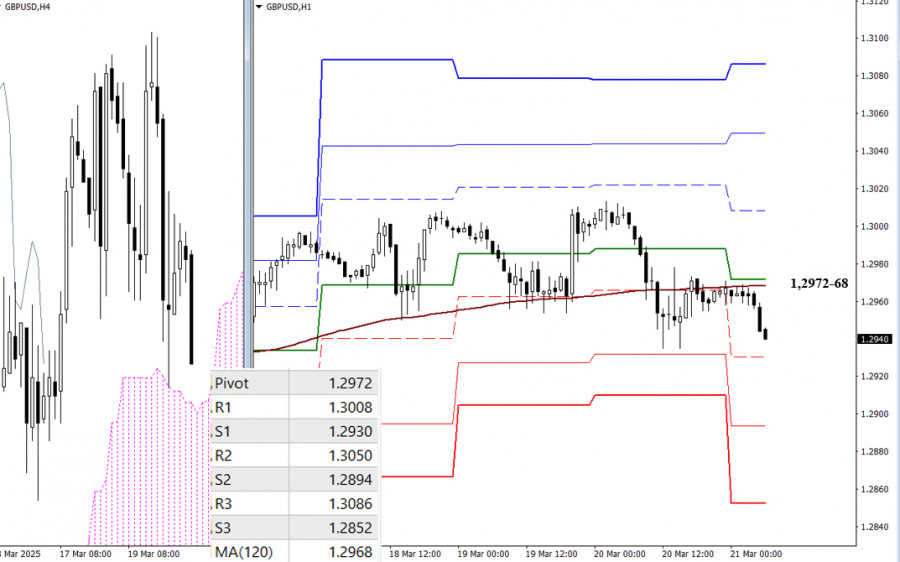
On the lower timeframes, sellers have consolidated below key levels, giving them a technical advantage. To push further downward today, bears will aim to break the classic Pivot supports: 1.2930 – 1.2894 – 1.2852. To reverse the situation, bulls would need to break and hold above the key zone at 1.2972–1.2968 (daily central Pivot + weekly long-term trend), thereby reversing the trend. Continuation of the upward move would require pushing through the Pivot resistance levels: 1.3008 – 1.3050 – 1.3086.

***

Technical Analysis Components:
  • Higher Timeframes: Ichimoku Kinko Hyo (9.26.52) and Fibonacci Kijun levels
  • H1: Classic Pivot Points and 120-period Moving Average (weekly long-term trend)
Evangelos Poulakis,
Especialista em análise na InstaForex
© 2007-2025
Selecionar intervalo de tempo
5
min
15
min
30
min
1
hora
4
horas
1
dia
1
s.
Ganhe com as variações das taxas das criptomoedas com a InstaForex.
Baixe o MetaTrader 4 e abra a sua primeira operação.
  • Grand Choice
    Contest by
    InstaForex
    InstaForex always strives to help you
    fulfill your biggest dreams.
    PARTICIPE DO CONCURSO

Recommended Stories

Sinais de negociação para o EUR/USD para 2-5 de julho de 2025: venda abaixo de 1,1840 (+1/8 de Murray - SMA 21)

Se o euro romper abaixo de 1,1762 e se consolidar abaixo dessa zona de preço, é possível uma aceleração de baixa. Portanto, o EUR/USD pode atingir a parte inferior

Dimitrios Zappas 19:30 2025-07-02 UTC+2

Sinais de negociação para o OURO (XAU/USD) para 2-8 de julho de 2025: comprar acima de 3.325 (SMA 21 - EMA 200)

O ouro pode estar se preparando para uma nova sequência de alta, de modo que o preço se consolide acima de 3.325 ou 3.312. Qualquer recuperação técnica será vista como

Dimitrios Zappas 19:26 2025-07-02 UTC+2

O AUD/USD poderá testar seu nível de resistência mais próximo na quarta-feira, 2 de julho de 2025.

AUD/USD – Quarta-feira, 2 de julho de 2025 O par de moedas AUD/USD foi impulsionado pela desvalorização do dólar americano devido à incerteza da guerra tarifária e à pressão para

Arief Makmur 16:15 2025-07-02 UTC+2

Previsão para o EUR/USD em 2 de julho de 2025

Na terça-feira, o par EUR/USD fez uma tentativa fracassada de se consolidar acima do nível 1,1802. Hoje, uma recuperação a partir desse nível favoreceria o dólar americano e uma queda

Samir Klishi 15:36 2025-07-02 UTC+2

Previsão para o GBP/USD em 2 de julho de 2025

No gráfico horário, o par GBP/USD continuou em alta na terça-feira, embora os compradores tenham recuado levemente, permitindo uma consolidação abaixo do nível corretivo de 200,0%, em 1,3749. Contudo, esse

Samir Klishi 14:54 2025-07-02 UTC+2

Embora o EUR/GBP tenha potencial para ser corrigido, há uma oportunidade para se fortalecer novamente, quarta-feira, 2 de julho de 2025.

EUR/GBP – Quarta-feira, 2 de julho de 2025 O EUR/GBP pode se fortalecer devido à política do BCE, que sinaliza que sua política dovish está quase no fim, enquanto

Arief Makmur 14:48 2025-07-02 UTC+2

Previsão para o EUR/USD em 2 de julho de 2025

Assim, a cotação do euro alcançou o ponto X. Ontem à noite, no gráfico semanal, o preço atingiu o limite superior do canal de preços, um raio de Fibonacci

Laurie Bailey 14:44 2025-07-02 UTC+2

Previsão para o GBP/USD em 2 de julho de 2025

No gráfico diário, a linha de sinal do oscilador Marlin está se movendo para baixo de forma linear, ignorando a variação de preço de 120 pips. Isso sugere

Laurie Bailey 14:39 2025-07-02 UTC+2

Previsão para o AUD/USD em 2 de julho de 2025

No gráfico semanal, o dólar australiano rompeu uma resistência muito forte, formada pela linha do canal de preços e pela linha do MACD, especialmente no ponto de interseção entre ambas

Laurie Bailey 14:27 2025-07-02 UTC+2

Análise técnica para julho de 2025 do par de moedas GBP/USD

Análise de tendência: Em julho, o preço pode continuar a subir a partir do nível 1,3769 (preço de fechamento da vela mensal de junho) em direção ao alvo 1,3816

Stefan Doll 20:20 2025-07-01 UTC+2
Não pode falar agora?
Faça sua pergunta no chat.
Widget callback
 

Dear visitor,

Your IP address shows that you are currently located in the USA. If you are a resident of the United States, you are prohibited from using the services of InstaFintech Group including online trading, online transfers, deposit/withdrawal of funds, etc.

If you think you are seeing this message by mistake and your location is not the US, kindly proceed to the website. Otherwise, you must leave the website in order to comply with government restrictions.

Why does your IP address show your location as the USA?

  • - you are using a VPN provided by a hosting company based in the United States;
  • - your IP does not have proper WHOIS records;
  • - an error occurred in the WHOIS geolocation database.

Please confirm whether you are a US resident or not by clicking the relevant button below. If you choose the wrong option, being a US resident, you will not be able to open an account with InstaForex anyway.

We are sorry for any inconvenience caused by this message.