empty
10.03.2025 09:49 AM
EUR/USD and GBP/USD March 10 – Technical Analysis

EUR/USD

This image is no longer relevant

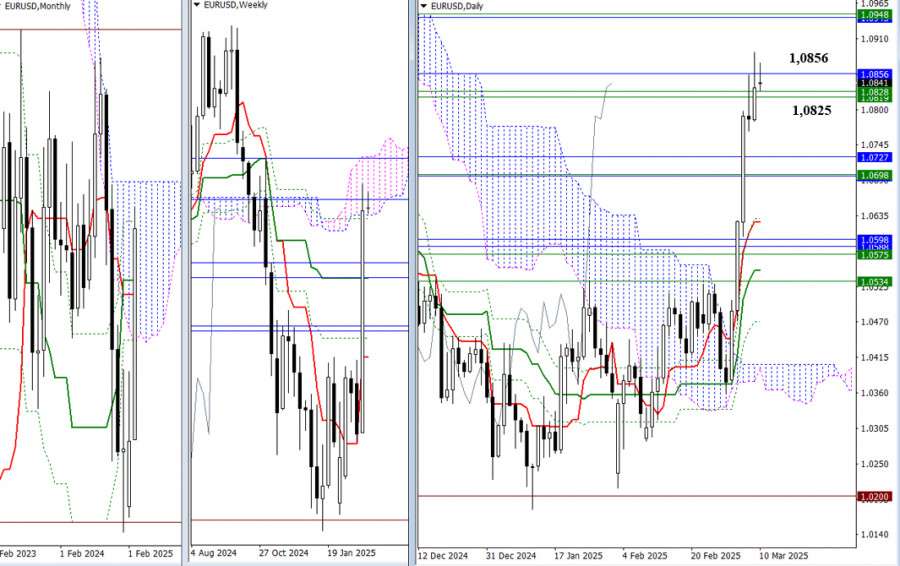
Last week, the EUR/USD pair closed within the weekly cloud, with the lower boundary at 1.0825. It reached the final level of the monthly Ichimoku cross at 1.0856. If the pair successfully overcomes these resistance levels, it will pave the way to the upper boundaries of the Ichimoku cloud at the monthly level (1.0943) and the weekly level (1.0948). Conversely, a rebound from the tested range of 1.0825 to 1.0856 could push the pair back toward previous clusters of resistance around 1.0727 to 1.0696, which align with the weekly medium-term trend as well as the monthly Tenkan and Kijun lines.

This image is no longer relevant

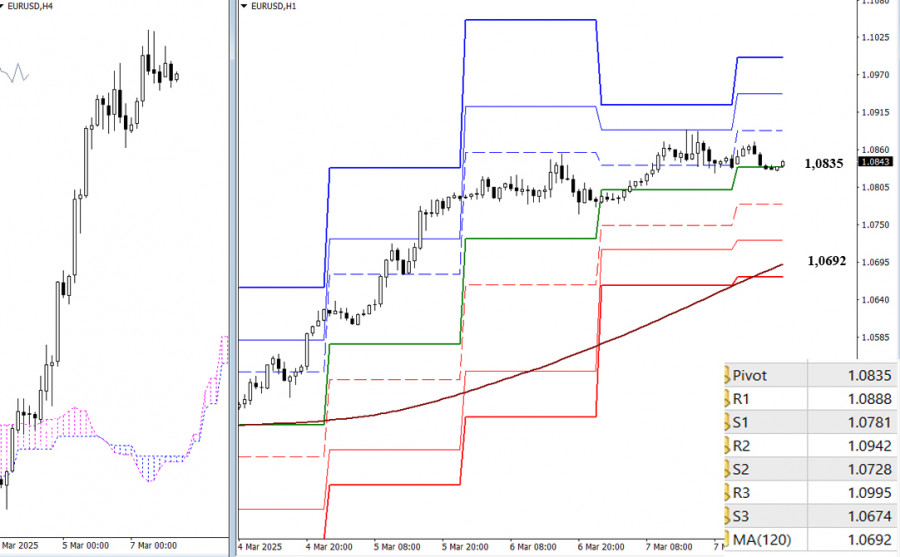
On lower timeframes, buyers currently hold the advantage. To maintain the upward movement, they need to break through the resistance at the classic Pivot levels for the day, which are positioned at 1.0888, 1.0942, and 1.0995. If the upward momentum fails, sellers may test the support levels at the classic Pivot points (1.0781 to 1.0728) before reaching the weekly long-term trend at 1.0692. This trend is crucial in determining the current balance of power, so a breakout and reversal below this level would enable sellers to plan for a longer-term downward move.

***

GBP/USD

This image is no longer relevant

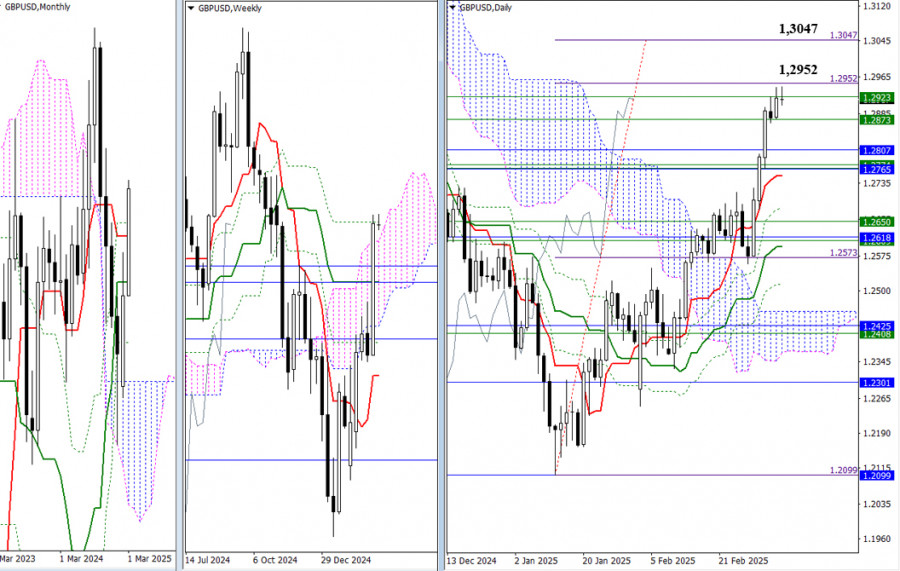
Buyers are currently facing a significant resistance zone. Although several levels have been surpassed, the target for a breakout, represented by the daily Ichimoku cloud (ranging from 1.2952 to 1.3047), remains a hurdle. A successful breakout and consolidation above this zone could lead to new bullish targets, including a potential rise to the nearest high at 1.3433. However, if buyers fail at this point, bearish activity could revert to the previously established support zone (between 1.2873 and 1.2751).

This image is no longer relevant

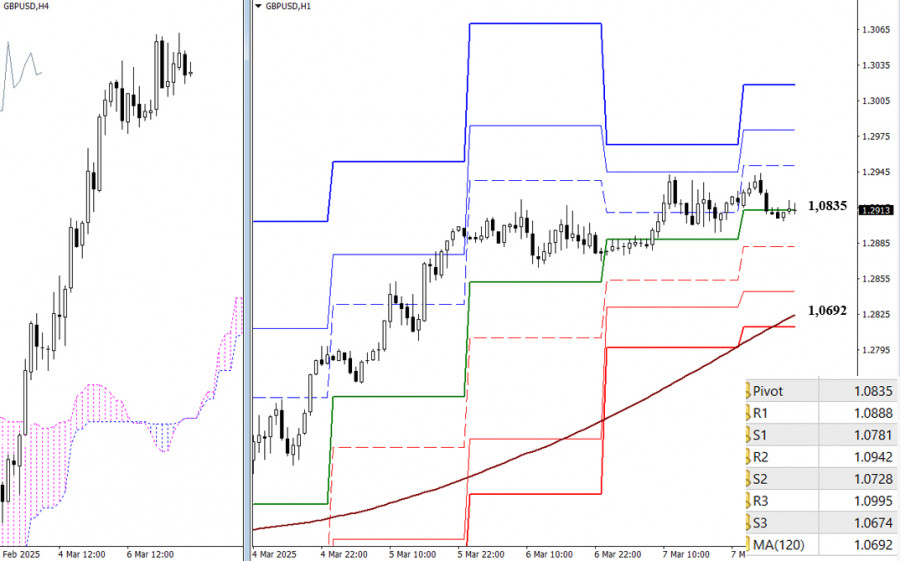
On lower timeframes, buyers are in a more favorable position. Key reference points for maintaining upward momentum throughout the day are located at the classic Pivot levels of 1.2950, 1.2981, and 1.3018. If a corrective decline occurs, the pair may find support at the classic Pivot levels (ranging from 1.2882 to 1.2845), followed by a longer-term weekly trend line at 1.0692. A breakout below this trend could shift the balance of power in favor of sellers.

***

Technical Analysis Components:
  • Higher Timeframes: Ichimoku Kinko Hyo (9.26.52) and Fibonacci Kijun levels
  • H1: Classic Pivot Points and 120-period Moving Average (weekly long-term trend)
Evangelos Poulakis,
Especialista em análise na InstaForex
© 2007-2025
Selecionar intervalo de tempo
5
min
15
min
30
min
1
hora
4
horas
1
dia
1
s.
Ganhe com as variações das taxas das criptomoedas com a InstaForex.
Baixe o MetaTrader 4 e abra a sua primeira operação.
  • Grand Choice
    Contest by
    InstaForex
    InstaForex always strives to help you
    fulfill your biggest dreams.
    PARTICIPE DO CONCURSO

Recommended Stories

Análise técnica do movimento intradiário de preços do EUR/USD, terça-feira, 10 de junho de 2025.

Com o surgimento do padrão Cunha Ascendente Expandida, seguido pela formação do padrão 123 de baixa, há uma indicação de que o EUR/USD tem potencial para se enfraquecer

Arief Makmur 14:39 2025-06-10 UTC+2

Análise técnica do movimento intradiário de preços do par GBP/JPY, terça-feira, 10 de junho de 2025

No gráfico de 4 horas do par cruzado GBP/JPY, é possível observar alguns aspectos interessantes. Em primeiro lugar, o movimento de preço permanece acima da média móvel ponderada

Arief Makmur 14:33 2025-06-10 UTC+2

Sinais de negociação para o OURO (XAU/USD) para 9-12 de junho de 2025: venda abaixo de $3.350 ( SMA 21 - 7/8 de Murray)

No início da sessão americana, o ouro está sendo negociado perto de 3.317, recuperando-se depois de atingir uma baixa de 3.294 durante a sessão europeia. No gráfico 4H, o ouro

Dimitrios Zappas 21:27 2025-06-09 UTC+2

Sinais de negociação para O EUR/USD para 9-12 de junho de 2025: venda abaixo de 1,1415 (SMA 21 - 6/8 DE Murray)

Acreditamos que o euro possa continuar a cair, já que um padrão de continuação de baixa está se formando, mas devemos esperar que ele caia abaixo de 1,1400, podendo então

Dimitrios Zappas 21:24 2025-06-09 UTC+2

Previsão para o GBP/USD em 9 de junho de 2025

No gráfico horário, o par GBP/USD continuou a cair na sexta-feira e atingiu o nível de correção de Fibonacci de 161,8% em 1,3520. Uma recuperação a partir desse nível favoreceu

Samir Klishi 16:31 2025-06-09 UTC+2

Previsão para o EUR/USD em 9 de junho de 2025

Na sexta-feira, o par EUR/USD caiu para a zona de suporte de 1,1374–1,1380, recuperou e virou a favor do euro. Na segunda-feira, começou um novo movimento de alta em direção

Samir Klishi 15:08 2025-06-09 UTC+2

EUR/USD. Análise e previsão

Hoje, o par EUR/USD está atraindo compradores, recuperando parte das perdas de sexta-feira em meio a um dólar americano mais fraco. De uma perspectiva técnica, o par EUR/USD mostra atualmente

Irina Yanina 14:48 2025-06-09 UTC+2

Previsão para o EUR/USD em 9 de junho de 2025

Os dados moderadamente otimistas sobre o emprego nos EUA reanimaram o dólar, fazendo com que ele subisse 0,44%. O euro caiu 50 pips. Ocorreu uma divergência com o mercado

Laurie Bailey 14:36 2025-06-09 UTC+2

Previsão para o GBP/USD em 9 de junho de 2025

Na sexta-feira, com o índice do dólar americano fortalecendo-se em 0,44%, a libra esterlina caiu 42 pips. No entanto, o oscilador Marlin permanece estável, apoiado por baixo pela linha zero

Laurie Bailey 14:34 2025-06-09 UTC+2

Previsão para EUR/USD em 6 de junho de 2025

Ontem, o BCE, como esperado, reduziu as taxas básicas em um quarto de ponto, levando a taxa de refinanciamento para 2,15%. Na coletiva de imprensa, a presidente do BCE, Christine

Laurie Bailey 17:08 2025-06-06 UTC+2
Não pode falar agora?
Faça sua pergunta no chat.
Widget callback
 

Dear visitor,

Your IP address shows that you are currently located in the USA. If you are a resident of the United States, you are prohibited from using the services of InstaFintech Group including online trading, online transfers, deposit/withdrawal of funds, etc.

If you think you are seeing this message by mistake and your location is not the US, kindly proceed to the website. Otherwise, you must leave the website in order to comply with government restrictions.

Why does your IP address show your location as the USA?

  • - you are using a VPN provided by a hosting company based in the United States;
  • - your IP does not have proper WHOIS records;
  • - an error occurred in the WHOIS geolocation database.

Please confirm whether you are a US resident or not by clicking the relevant button below. If you choose the wrong option, being a US resident, you will not be able to open an account with InstaForex anyway.

We are sorry for any inconvenience caused by this message.