empty
07.04.2023 12:06 AM
Technical analysis of EUR/USD for April 06, 2023

This image is no longer relevant

Overview :

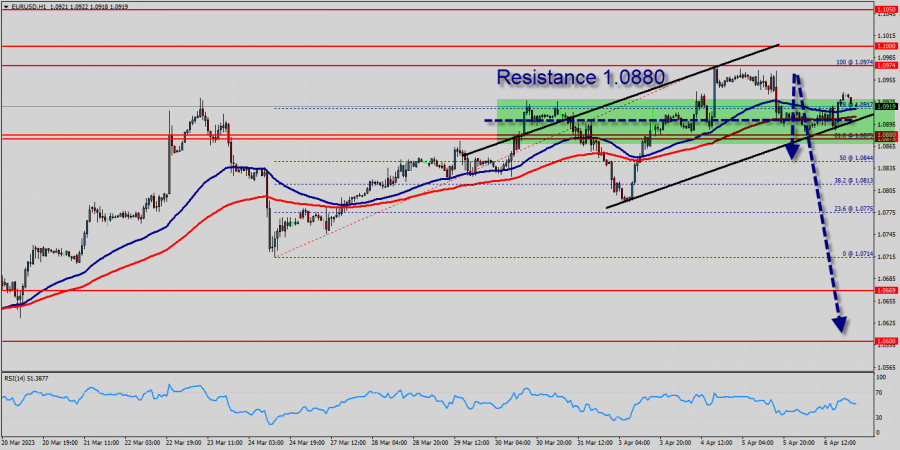
Since last week, the EUR/USD pair has faced strong resistances at the levels of 1.0880 because support had become resistance last week. So, the strong resistance has been already formed at the level of 1.0880 and the pair is likely to try to approach it in order to test it again. However, if the pair fails to pass through the level of 1.0880, the market will indicate a bearish opportunity below the new strong resistance level of 1.0880 (the level of 1.0880 coincides with a ratio of 61.8% Fibonacci - last bullish wave - double top).

Moreover, the RSI starts signaling a downward trend, as the trend is still showing strength above the moving average (100) and (50). The trend of EUR/USD pair movement was controversial as it took place in the downtrend channel. Due to the previous events, the price is still set between the levels of 1.0808 and 1.0669, so it is recommended to be careful while making deals in these levels because the prices of 1.0808 and 1.0669 are representing the resistance and support respectively.

It is necessary to wait till the downtrend channel is passed through. Then the market will probably show the signs of a bearish market. It should be noted that the volatility is very high for that the price of the EUR/USD pair is still trading between the prices of 1.0669 and 1.0808 in the coming hours. Furthermore, the price has been set below the strong resistance at the levels of 1.0808 and 1.0851 which coincide with the ratios of Fibonacci retracement levels respectively. Thus, the market is indicating a bearish opportunity below 1.0880 so it will be good to sell at 1.0808 with the first target of 1.0669.

It will also call for a downtrend in order to continue towards 1.0630. The daily strong support is seen at 1.0600. However, the stop loss should always be taken into account, for that it will be reasonable to set your stop loss at the level of 1.0851. Moving averages, in the meantime, maintain their bearish slope way above the current level.

Furthermore, although the news is bearish for the EUR/USD pair, professional may not want to sell weakness, but rather following a rebound rally. Additionally, some aggressive counter-trend buyers may be defending parity. In case a continuisions takes place and the EUR/USD pair breaks through the support level of 1.0669, a further decline to 1.0600 can occur which would indicate a bearish market.

The EUR/USD pair didn't make any significant movements yesterday. There are no changes in our technical outlook. The bias remains bearish in the nearest term testing 1.0669 or lower. Immediate support is seen around 1.0669. A clear break below that area could lead price to the neutral zone in the nearest term. Price will test 1.06030, because in general, we remain bearish on between Feb 13rd and Feb 18th, 2023. The market moved from its bottom at 1.0669 and continued to rise towards the top of 1.0680. Today, on the one-hour chart, the current rise will remain within a framework of correction.

This image is no longer relevant

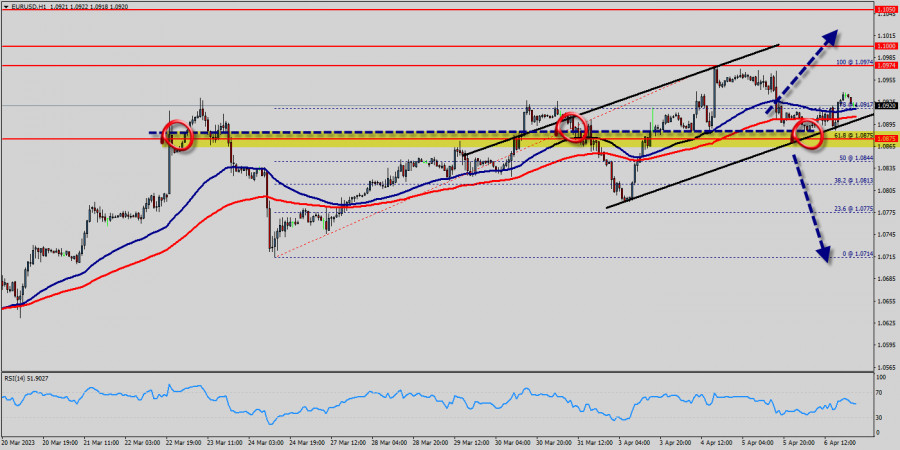
However, if the pair fails to pass through the level of 1.0732 (major resistance), the market will indicate a bearish opportunity below the strong resistance level of 1.0669 (the level of 1.0669 coincides with the ratio of 00% Fibonacci retracement - last bearish wave). This resistance has been rejected several times confirming the downtrend. Additionally, the RSI starts signaling a downward trend.

The trend is still below the 100 EMA for that the bearish outlook remains the same as long as the 100 EMA is headed to the downside. Since there is nothing new in this market, it is not bullish yet. Sell deals are recommended below the level of 1.0669 with the first target at 1.0630 so as to test the double bottom. If the trend breaks the double bottom level of 1.0600, the pair is likely to move downwards continuing the development of a bearish trend to the level of 1.0600 in order to test the weekly support 2. The third weekly support is set at the price of 1.0543.

Mourad El Keddani,
Especialista em análise na InstaForex
© 2007-2025
Selecionar intervalo de tempo
5
min
15
min
30
min
1
hora
4
horas
1
dia
1
s.
Ganhe com as variações das taxas das criptomoedas com a InstaForex.
Baixe o MetaTrader 4 e abra a sua primeira operação.
  • Grand Choice
    Contest by
    InstaForex
    InstaForex always strives to help you
    fulfill your biggest dreams.
    PARTICIPE DO CONCURSO

Recommended Stories

EUR/USD. 12 de junho. Um revés para o dólar

Bom dia, caros traders! Na quarta-feira, o par EUR/USD continuou seu movimento de alta após se recuperar da zona de suporte de 1,1374–1,1380. Ele se consolidou com sucesso acima

Samir Klishi 16:33 2025-06-12 UTC+2

Análise técnica do movimento diário do preço do Petróleo Bruto (#CL), terça-0feira 12 de junho de 2025

Se observarmos o gráfico diário do Petróleo Bruto (#CL), é possível identificar uma divergência entre o movimento dos preços do ativo e o indicador Estocástico. Isso sugere a possibilidade

Arief Makmur 15:39 2025-06-12 UTC+2

Análise Técnica do Movimento Intradiário do Índice Nasdaq 100 – Quinta-feira, 12 de junho de 2025.

No gráfico de 4 horas do índice Nasdaq 100, podemos observar uma divergência entre o movimento dos preços e o indicador Estocástico, especialmente com a confirmação atual

Arief Makmur 15:25 2025-06-12 UTC+2

Previsão para o EUR/USD para 12 de junho de 2025

Os dados de inflação dos EUA divulgados na quarta-feira agitaram os mercados: o índice do dólar recuou 0,47%, o petróleo WTI disparou 5,54%, o ouro avançou 1,27% e os rendimentos

Laurie Bailey 15:11 2025-06-12 UTC+2

Previsão para o GBP/USD para 12 de junho de 2025

Na quarta-feira, a libra esterlina conseguiu evitar uma queda abaixo de níveis de suporte técnico, revertendo sua direção a partir desses pontos. O preço se recuperou a partir da linha

Laurie Bailey 15:07 2025-06-12 UTC+2

Previsão para o USD/JPY em 12 de junho de 2025

A correção de preço desde 27 de maio foi complexa e prolongada, apresentando risco de um rompimento acima de 146,11. No entanto, esse risco deixou de ser relevante após

Laurie Bailey 14:56 2025-06-12 UTC+2

Sinais de negociação para o par ER/USD para 12-19 de junho de 2025: vender abaixo de 1.1500 (SMA 21 - 8/8 de Murray)

Se o preço do euro cair abaixo de 1,1500 nas próximas horas, isso pode ser visto como uma oportunidade de venda. Tecnicamente, ele parece estar sobrecomprado no gráfico

Dimitrios Zappas 14:45 2025-06-12 UTC+2

Sinais de negociação para o OURO (XAU/USD) para 12-19 de junho de 2025: venda abaixo de $3.386 ( SMA 21 - 7/8 de Murray)

A tendência do XAU/USD permanece de alta enquanto o preço se consolidar acima de 3.331. Portanto, seria prudente comprar ouro enquanto o preço se consolidar acima de 3.359, onde está

Dimitrios Zappas 14:43 2025-06-12 UTC+2

GBP/USD. 12 de junho. Economia britânica vacila

Bom dia, caros traders! No gráfico horário, na quarta-feira, o par GBP/USD reverteu a favor da libra esterlina e se consolidou acima do nível de retração Fibonacci de 161,8%

Samir Klishi 14:16 2025-06-12 UTC+2

Previsão para a prata para 11 de junho de 2025

Nas últimas sete sessões, a prata apresentou um movimento ascendente expressivo, mas o potencial de alta ainda está longe de ter se esgotado. O alvo em 38,500 — o limite

Laurie Bailey 22:29 2025-06-11 UTC+2
Não pode falar agora?
Faça sua pergunta no chat.
Widget callback
 

Dear visitor,

Your IP address shows that you are currently located in the USA. If you are a resident of the United States, you are prohibited from using the services of InstaFintech Group including online trading, online transfers, deposit/withdrawal of funds, etc.

If you think you are seeing this message by mistake and your location is not the US, kindly proceed to the website. Otherwise, you must leave the website in order to comply with government restrictions.

Why does your IP address show your location as the USA?

  • - you are using a VPN provided by a hosting company based in the United States;
  • - your IP does not have proper WHOIS records;
  • - an error occurred in the WHOIS geolocation database.

Please confirm whether you are a US resident or not by clicking the relevant button below. If you choose the wrong option, being a US resident, you will not be able to open an account with InstaForex anyway.

We are sorry for any inconvenience caused by this message.