empty
20.04.2022 05:59 PM
EUR/USD hot forecast on 20th April

This image is no longer relevant

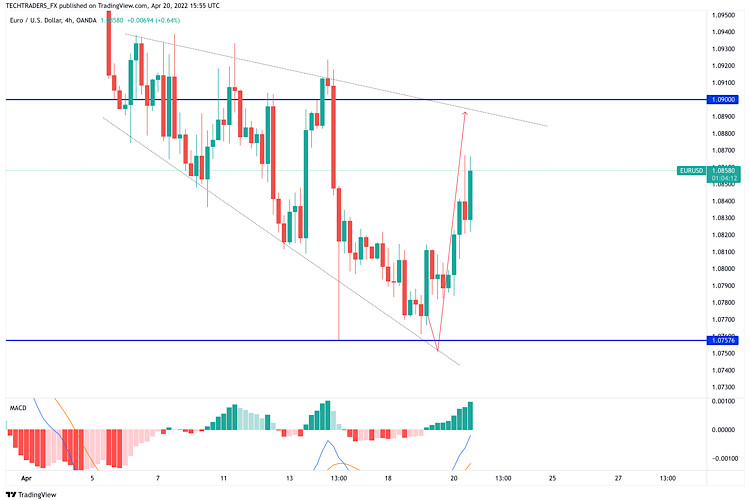
EUR/USD has regained its traction and advanced above 1.0850 after retreating toward 1.0820 in the early American session. With the benchmark 10-year US T-bond yield falling more than 2% on the day, the greenback continues to weaken against its rivals and helps the pair edge higher.

The EUR/USD pair is up for a second consecutive day but far from turning bullish. It has briefly surpassed the 23.6% retracement of its latest daily decline measured between 1.1184 and 1.0756 at 1.0856, an immediate resistance level. The next Fibonacci retracement comes at 1.0920, and recovery beyond it could put the pair on a near-term bullish path.

Technical readings in the daily chart suggest that the risk is skewed to the downside. The 20 SMA heads are firmly lower, converging with the 38.2% retracement of the aforementioned decline, as technical indicators recover from near oversold readings, still well below their midlines.

The 4-hour chart shows favors another leg north, particularly if the pair moves above the aforementioned Fibonacci resistance. The pair is developing above a now flat 20 SMA, while the longer ones maintain their bearish slopes well above the current level. Technical indicators, in the meantime, are neutral-to-bullish within positive levels, reflecting absent selling interest at the time being.

Support levels: 1.0795 1.0760 1.0720

Resistance levels:1.0865 1.0920 1.0970

Jan Novotny,
Especialista em análise na InstaForex
© 2007-2025
Summary
Urgency
Analytic
Jan Novotny
Start trade
Ganhe com as variações das taxas das criptomoedas com a InstaForex.
Baixe o MetaTrader 4 e abra a sua primeira operação.
  • Grand Choice
    Contest by
    InstaForex
    InstaForex always strives to help you
    fulfill your biggest dreams.
    PARTICIPE DO CONCURSO

Recommended Stories

Previsão para o EUR/USD em 13 de agosto de 2025

Na terça-feira, o par EUR/USD continuou seu movimento de alta após rebater no nível de retração de 50,0% em 1,1590. Também se consolidou acima da zona de resistência de 1,1637–1,1645

Samir Klishi 14:43 2025-08-13 UTC+2

Previsão para o GBP/USD em 13 de agosto de 2025

No gráfico horário, o par GBP/USD na terça-feira voltou a se recuperar da zona de suporte de 1,3416–1,3425 e virou a favor da libra, consolidando-se posteriormente acima do nível

Samir Klishi 14:33 2025-08-13 UTC+2

Sinais de negociação para OURO (XAU/USD) de 12 a 15 de agosto de 2025: comprar acima de US$ 3.341 ou vender abaixo de US$ 3.335 (SMA 21 - EMA 200).

Se o ouro testar o nível de 3.340 nas próximas horas e conseguir se manter acima dessa área, isso será visto como uma oportunidade de compra, com alvos em 3.360

Dimitrios Zappas 18:10 2025-08-12 UTC+2

Embora o viés do Lonnie permaneça forte, o aparecimento de uma divergência no RSI(14) indica uma correção. Terça-feira, 12 de agosto de 2025.

[USD/CAD] – [terça-feira, 12 de agosto de 2025] Apesar do surgimento de divergência entre o RSI(14) e os movimentos de preço do dólar canadense, a cruz dourada entre a EMA(50)

Arief Makmur 17:02 2025-08-12 UTC+2

Há potencial para fraqueza em meio ao domínio dos compradores no GBP/USD. Terça-feira, 12 de agosto de 2025.

[GBP/USD] – [Terça-feira, 12 de agosto de 2025] Há potencial para uma correção de baixa no Cabo hoje, mas, desde que não rompa e feche abaixo de 1,3357, a tendência

Arief Makmur 16:44 2025-08-12 UTC+2

Sinais de negociação para ETH/USD (Ethereum) para 12-15 de agosto de 2025: venda abaixo de US$ 4.205 (EMA 200- 6/8 de Murray)

Se o Ether se consolidar abaixo de 4.205 nos gráficos 4H, poderá atingir o nível 5/8 de Murray em 4.062 e, eventualmente, alcançar o nível 4/8 de Murray em 3.750

Dimitrios Zappas 16:19 2025-08-12 UTC+2

Sinais de negociação para o EUR/USD de 12 a 15 de Agosto de 2025: vender abaixo de 1.1647 (EMA 200 - 7/8 de Murray)

O euro está sendo negociado próximo de 1,1618, acima da EMA de 200 períodos e acima do nível 6/8 de Murray, recuperando parte das perdas do dia anterior, mas apresentando

Dimitrios Zappas 15:26 2025-08-12 UTC+2

Previsão para o GBP/USD em 12 de agosto de 2025

No gráfico horário, o GBP/USD na segunda-feira caiu até a área de suporte entre 1,3416 e 1,3425 e reverteu próximo a essa região em favor da libra. Isso retomou

Samir Klishi 14:54 2025-08-12 UTC+2

Previsão para EUR/USD em 12 de agosto de 2025

Na segunda-feira, o par EUR/USD caiu para o nível de retração de 50,0% em 1,1590 e recuou a partir dele. Como resultado, completou-se uma reversão a favor do euro

Samir Klishi 14:34 2025-08-12 UTC+2

XAU/USD: Análise e revisão

Do ponto de vista técnico, o ouro mantém-se acima da Média Móvel Simples (SMA) de 200 períodos no gráfico de 4 horas, que atua como suporte-chave. Considerando que os osciladores

Irina Yanina 14:12 2025-08-12 UTC+2
Não pode falar agora?
Faça sua pergunta no chat.
Widget callback
 

Dear visitor,

Your IP address shows that you are currently located in the USA. If you are a resident of the United States, you are prohibited from using the services of InstaFintech Group including online trading, online transfers, deposit/withdrawal of funds, etc.

If you think you are seeing this message by mistake and your location is not the US, kindly proceed to the website. Otherwise, you must leave the website in order to comply with government restrictions.

Why does your IP address show your location as the USA?

  • - you are using a VPN provided by a hosting company based in the United States;
  • - your IP does not have proper WHOIS records;
  • - an error occurred in the WHOIS geolocation database.

Please confirm whether you are a US resident or not by clicking the relevant button below. If you choose the wrong option, being a US resident, you will not be able to open an account with InstaForex anyway.

We are sorry for any inconvenience caused by this message.