


signal strength 1 of 5
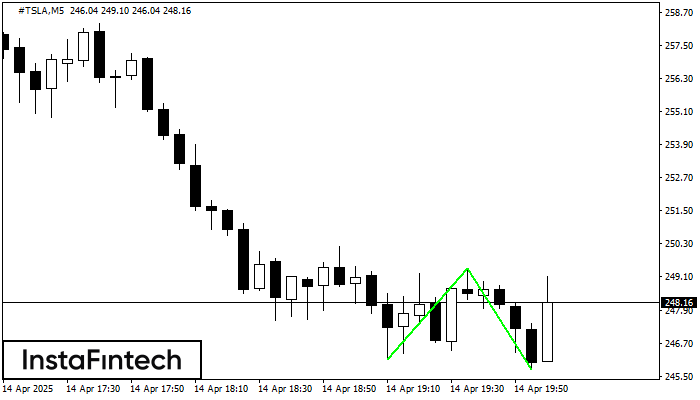
The Double Bottom pattern has been formed on #TSLA M5. This formation signals a reversal of the trend from downwards to upwards. The signal is that a buy trade should be opened after the upper boundary of the pattern 249.40 is broken. The further movements will rely on the width of the current pattern 329 points.
The M5 and M15 time frames may have more false entry points.
- All
- Double Top
- Flag
- Head and Shoulders
- Pennant
- Rectangle
- Triangle
- Triple top
- All
- #AAPL
- #AMZN
- #Bitcoin
- #EBAY
- #FB
- #GOOG
- #INTC
- #KO
- #MA
- #MCD
- #MSFT
- #NTDOY
- #PEP
- #TSLA
- #TWTR
- AUDCAD
- AUDCHF
- AUDJPY
- AUDUSD
- EURCAD
- EURCHF
- EURGBP
- EURJPY
- EURNZD
- EURRUB
- EURUSD
- GBPAUD
- GBPCHF
- GBPJPY
- GBPUSD
- GOLD
- NZDCAD
- NZDCHF
- NZDJPY
- NZDUSD
- SILVER
- USDCAD
- USDCHF
- USDJPY
- USDRUB
- All
- M5
- M15
- M30
- H1
- D1
- All
- Buy
- Sale
- All
- 1
- 2
- 3
- 4
- 5
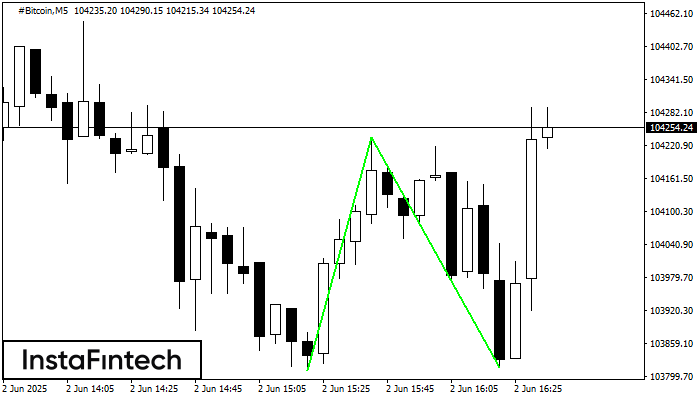
The Double Bottom pattern has been formed on #Bitcoin M5; the upper boundary is 104236.07; the lower boundary is 103815.25. The width of the pattern is 42583 points. In case
The M5 and M15 time frames may have more false entry points.
Open chart in a new window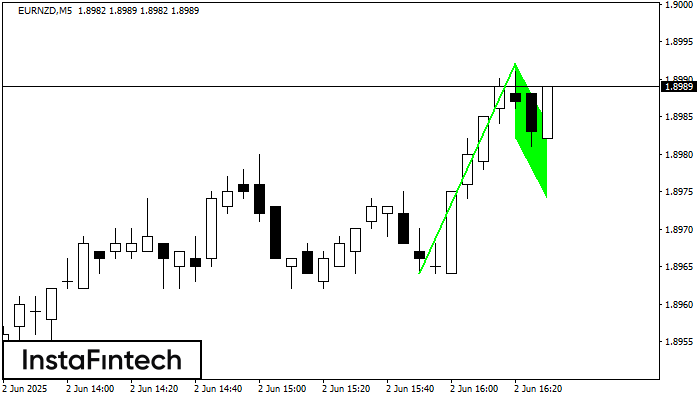
The Bullish Flag pattern has been formed on EURNZD at M5. The lower boundary of the pattern is located at 1.8982/1.8974, while the higher boundary lies at 1.8992/1.8984. The projection
The M5 and M15 time frames may have more false entry points.
Open chart in a new window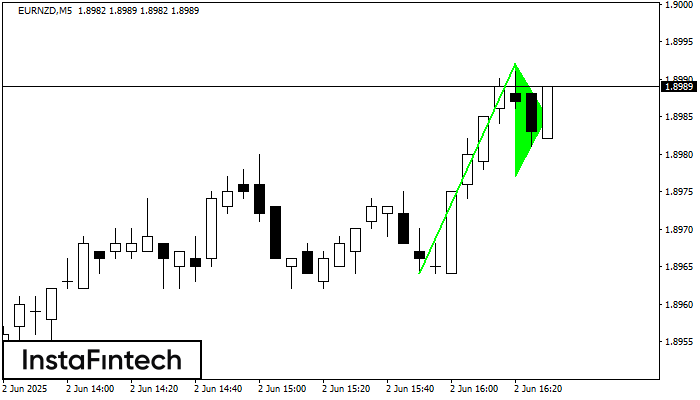
The Bullish pennant signal – Trading instrument EURNZD M5, continuation pattern. Forecast: it is possible to set up a buy position above the pattern’s high of 1.8992, with the prospect
The M5 and M15 time frames may have more false entry points.
Open chart in a new window


