

signal strength 2 of 5
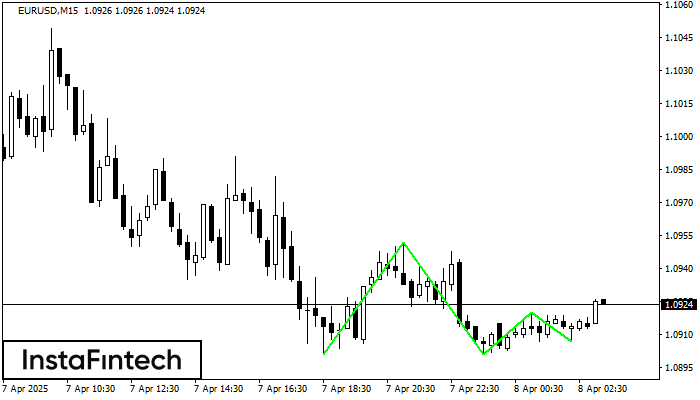
The Triple Bottom pattern has been formed on EURUSD M15. It has the following characteristics: resistance level 1.0952/1.0920; support level 1.0901/1.0907; the width is 51 points. In the event of a breakdown of the resistance level of 1.0952, the price is likely to continue an upward movement at least to 1.0924.
The M5 and M15 time frames may have more false entry points.
- All
- Double Top
- Flag
- Head and Shoulders
- Pennant
- Rectangle
- Triangle
- Triple top
- All
- #AAPL
- #AMZN
- #Bitcoin
- #EBAY
- #FB
- #GOOG
- #INTC
- #KO
- #MA
- #MCD
- #MSFT
- #NTDOY
- #PEP
- #TSLA
- #TWTR
- AUDCAD
- AUDCHF
- AUDJPY
- AUDUSD
- EURCAD
- EURCHF
- EURGBP
- EURJPY
- EURNZD
- EURRUB
- EURUSD
- GBPAUD
- GBPCHF
- GBPJPY
- GBPUSD
- GOLD
- NZDCAD
- NZDCHF
- NZDJPY
- NZDUSD
- SILVER
- USDCAD
- USDCHF
- USDJPY
- USDRUB
- All
- M5
- M15
- M30
- H1
- D1
- All
- Buy
- Sale
- All
- 1
- 2
- 3
- 4
- 5

По #Bitcoin на M5 сформировалась разворотная фигура «Двойная вершина». Характеристика: Верхняя граница 107140.52; Нижняя граница 106768.13; Ширина фигуры 38591 пунктов. Позицию на продажу возможно открыть ниже нижней границы 106768.13
Таймфреймы М5 и М15 могут иметь больше ложных точек входа.
Открыть график инструмента в новом окне
По #Bitcoin на M5 сформировалась фигура «Бычий симметричный треугольник». Нижняя граница фигуры имеет координаты 106253.43/106928.98, при этом верхняя граница 107645.53/106928.98. Формирование фигуры «Бычий симметричный треугольник» наиболее вероятным образом свидетельствует
Таймфреймы М5 и М15 могут иметь больше ложных точек входа.
Открыть график инструмента в новом окне
Сформирована фигура «Двойное дно» на графике AUDCHF M30. Данное формирование сигнализирует об изменении тенденции с нисходящего на восходящее движение. Сигнал: Торговую позицию на покупку следует открывать после пробоя верхней границы
Открыть график инструмента в новом окне


