


signal strength 3 of 5

According to the chart of M30, EURUSD formed the Bullish Symmetrical Triangle pattern. Description: This is the pattern of a trend continuation. 1.0849 and 1.0777 are the coordinates of the upper and lower borders respectively. The pattern width is measured on the chart at 72 pips. Outlook: If the upper border 1.0849 is broken, the price is likely to continue its move by 1.0844.
See Also
- All
- Double Top
- Flag
- Head and Shoulders
- Pennant
- Rectangle
- Triangle
- Triple top
- All
- #AAPL
- #AMZN
- #Bitcoin
- #EBAY
- #FB
- #GOOG
- #INTC
- #KO
- #MA
- #MCD
- #MSFT
- #NTDOY
- #PEP
- #TSLA
- #TWTR
- AUDCAD
- AUDCHF
- AUDJPY
- AUDUSD
- EURCAD
- EURCHF
- EURGBP
- EURJPY
- EURNZD
- EURRUB
- EURUSD
- GBPAUD
- GBPCHF
- GBPJPY
- GBPUSD
- GOLD
- NZDCAD
- NZDCHF
- NZDJPY
- NZDUSD
- SILVER
- USDCAD
- USDCHF
- USDJPY
- USDRUB
- All
- M5
- M15
- M30
- H1
- D1
- All
- Buy
- Sale
- All
- 1
- 2
- 3
- 4
- 5
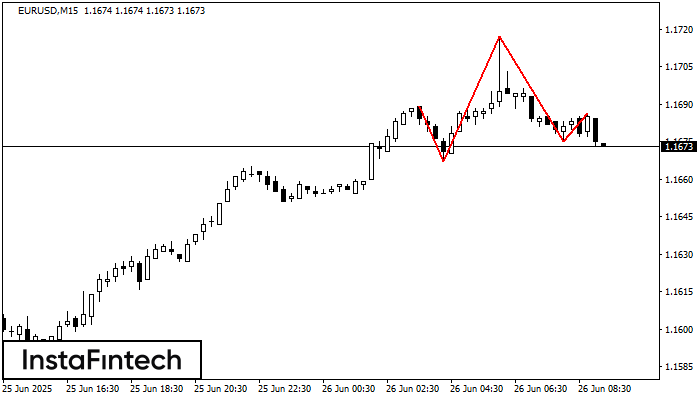
The technical pattern called Head and Shoulders has appeared on the chart of EURUSD M15. There are weighty reasons to suggest that the price will surpass the Neckline 1.1667/1.1675 after
The M5 and M15 time frames may have more false entry points.
Open chart in a new window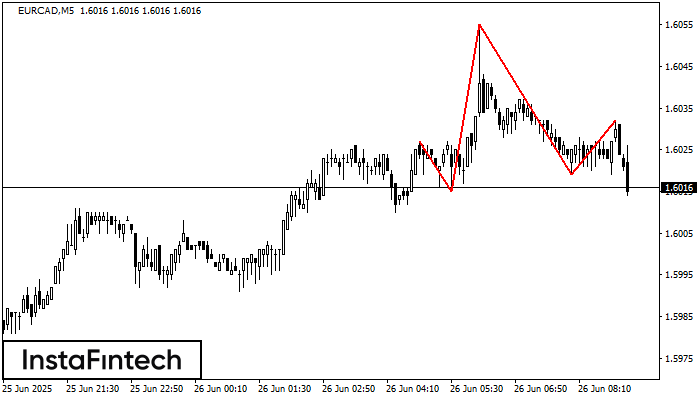
The EURCAD M5 formed the Head and Shoulders pattern with the following features: The Head’s top is at 1.6055, the Neckline and the upward angle are at 1.6015/1.6019. The formation
The M5 and M15 time frames may have more false entry points.
Open chart in a new window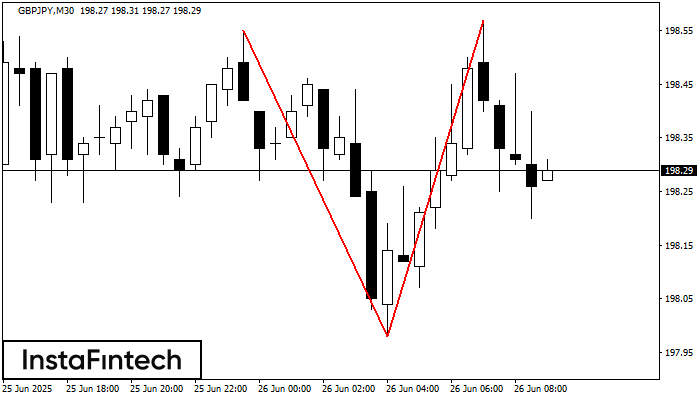
On the chart of GBPJPY M30 the Double Top reversal pattern has been formed. Characteristics: the upper boundary 198.57; the lower boundary 197.98; the width of the pattern 59 points
Open chart in a new window


