


signal strength 2 of 5
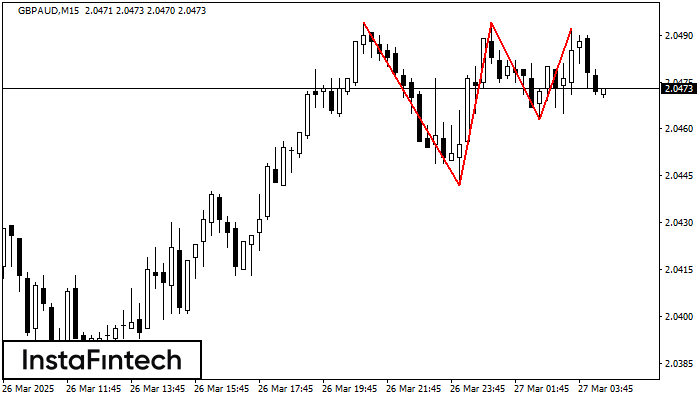
On the chart of the GBPAUD M15 trading instrument, the Triple Top pattern that signals a trend change has formed. It is possible that after formation of the third peak, the price will try to break through the resistance level 2.0442, where we advise to open a trading position for sale. Take profit is the projection of the pattern’s width, which is 52 points.
The M5 and M15 time frames may have more false entry points.
- All
- Double Top
- Flag
- Head and Shoulders
- Pennant
- Rectangle
- Triangle
- Triple top
- All
- #AAPL
- #AMZN
- #Bitcoin
- #EBAY
- #FB
- #GOOG
- #INTC
- #KO
- #MA
- #MCD
- #MSFT
- #NTDOY
- #PEP
- #TSLA
- #TWTR
- AUDCAD
- AUDCHF
- AUDJPY
- AUDUSD
- EURCAD
- EURCHF
- EURGBP
- EURJPY
- EURNZD
- EURRUB
- EURUSD
- GBPAUD
- GBPCHF
- GBPJPY
- GBPUSD
- GOLD
- NZDCAD
- NZDCHF
- NZDJPY
- NZDUSD
- SILVER
- USDCAD
- USDCHF
- USDJPY
- USDRUB
- All
- M5
- M15
- M30
- H1
- D1
- All
- Buy
- Sale
- All
- 1
- 2
- 3
- 4
- 5
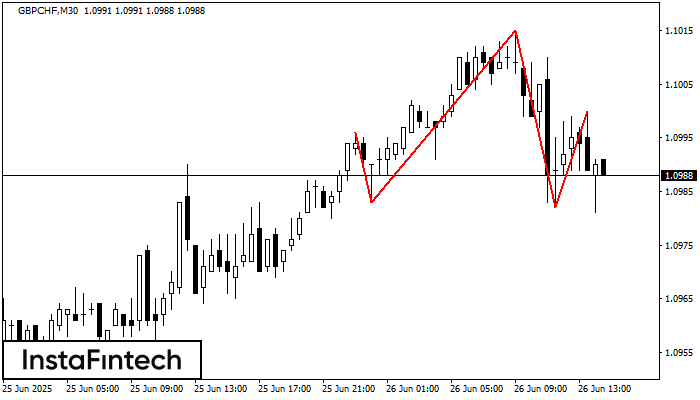
На графике GBPCHF M30 сформировалась фигура «Голова и плечи» с характеристикой: Вершина головы 1.1015; Уровень шеи, восходящий угол - 1.0983/1.0982. Формирование данной фигуры может привести к изменению текущей тенденции
Открыть график инструмента в новом окне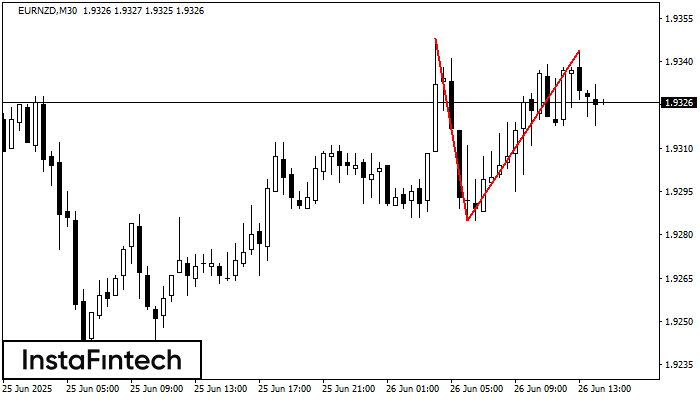
На торговом графике EURNZD M30 сформировалась разворотная фигура «Двойная вершина». Характеристика: Верхняя граница 1.9344; Нижняя граница 1.9285; Ширина фигуры 59 пунктов. Сигнал: Пробой нижней границы 1.9285 приведет к дальнейшему нисходящему
Открыть график инструмента в новом окне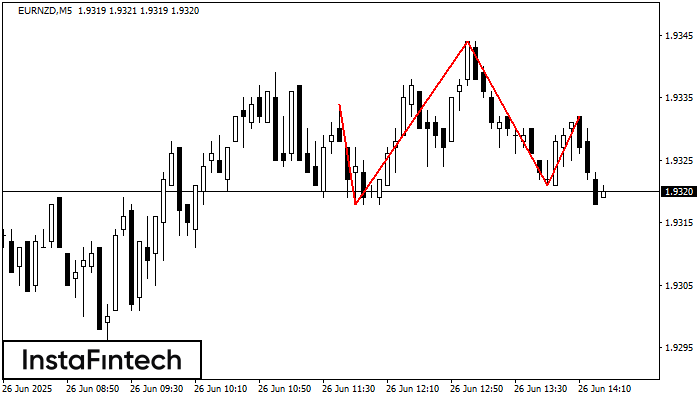
Графическая фигура «Голова и плечи» сформировалась по инструменту EURNZD на M5. Вероятно предполагать, что после формирования правого плеча цена преодолеет уровень шеи 1.9318/1.9321, изменяя тем самым тенденцию и фактически направляя
Таймфреймы М5 и М15 могут иметь больше ложных точек входа.
Открыть график инструмента в новом окне


