empty
04.02.2025 07:46 AM
#NDX – Technical Analysis Overview

This image is no longer relevant

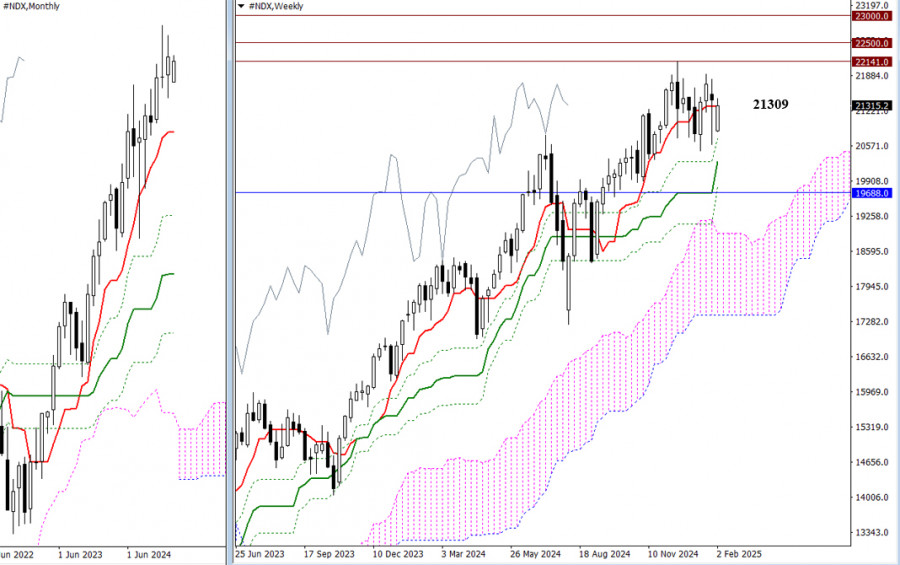
At the end of last year, the index reached a new all-time high of 22,141. Following that peak, the upward momentum stalled, leading to a correction and consolidation phase. Currently, the key focus is the weekly short-term trend level at 21,309. Even yesterday, despite a significant downward gap, prices managed to rebound back to the 21,309 area. Given the current conditions, we can identify the nearest benchmarks for potential market movement. If bullish activity continues, a breakout above the all-time high of 22,141 could pave the way for further gains, targeting the psychological levels of 22,500 and 23,000. On the other hand, if the consolidation phase ends with bearish momentum, the primary targets would involve breaking the Ichimoku weekly cross and a corrective decline towards the monthly short-term trend level at 19,688.

This image is no longer relevant

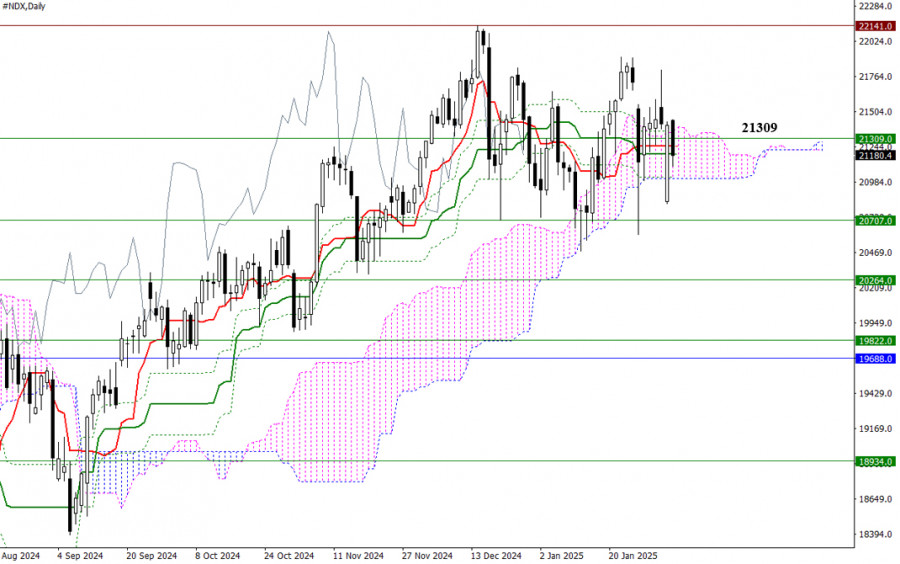
For two consecutive weeks, the market has opened with a significant downward gap, followed by rapid attempts to recover and close that gap. A clear struggle is occurring: one side is trying to push the index much lower, while the other side is working hard to maintain current levels. At present, the bulls have a clear path toward the all-time high of 22,141. The daily Ichimoku setup supports this scenario, featuring a daily cross and daily cloud, along with additional support from the weekly short-term trend at 21,309. If the market breaks below the daily cloud at 21,014, it would trigger a bearish target with further declines potentially reaching the monthly short-term trend at 19,688. Additional support along this trajectory may come from weekly levels at 20,707, 20,264, and 19,822.

This image is no longer relevant

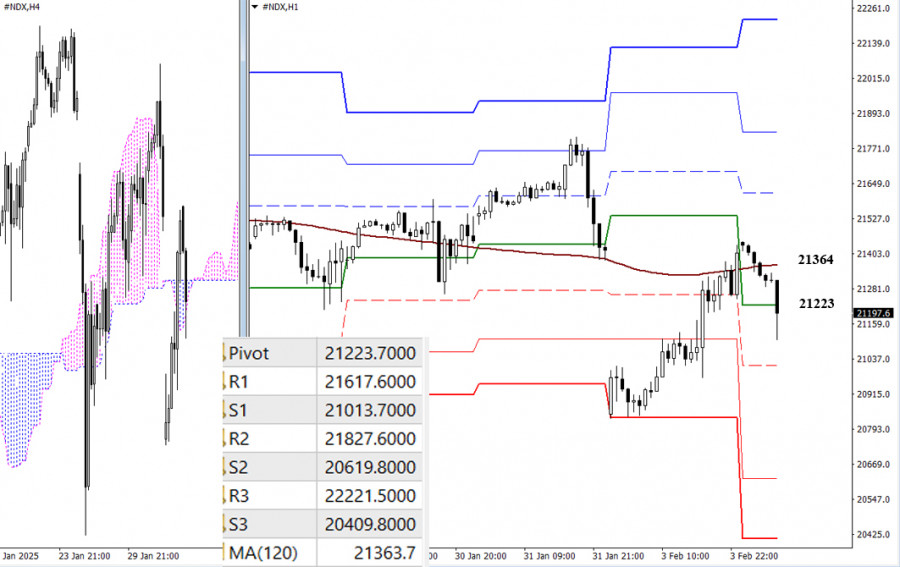
On lower timeframes, the bulls have managed to push the price back to the area of the weekly long-term trend, which is currently positioned at 21,364. The slope and position of this trend contribute to the prevailing uncertainty in the market. We may continue to see consolidation; however, if there are attempts to establish a directional move during the day, classic Pivot levels will serve as key reference points. For the bears, it will be crucial to break through support levels at 21,014, 20,620, and 20,410. Meanwhile, the bulls will be targeting resistance levels at 21,618, 21,828, and 22,222.

***

Technical Analysis Components:
  • Higher Timeframes: Ichimoku Kinko Hyo (9.26.52) and Fibonacci Kijun levels
  • H1: Classic Pivot Points and 120-period Moving Average (weekly long-term trend)
Evangelos Poulakis,
Analytical expert of InstaForex
© 2007-2025
Summary
Urgency
Analytic
Zhizhko Nadezhda
Start trade
Earn on cryptocurrency rate changes with InstaForex
Download MetaTrader 4 and open your first trade
  • Chancy Deposit
    Deposit your account with $3,000 and get $1000 more!
    In August we raffle $1000 within the Chancy Deposit campaign!
    Get a chance to win by depositing $3,000 to a trading account. Having fulfilled this condition, you become a campaign participant.
    JOIN CONTEST

Recommended Stories

Forex forecast 14/08/2025: EUR/USD, USD/JPY, GBP/USD, AUD/USD, Ethereum and Bitcoin

Useful links: My other articles are available in this section InstaForex course for beginners Popular Analytics Open trading account Important: The begginers in forex trading need to be very careful

Sebastian Seliga 09:07 2025-08-15 UTC+2

GBP/USD Forecast for August 15, 2025

Yesterday's U.S. producer inflation data for July showed a sharp jump: 0.9% for the month and 3.3% y/y versus 2.4% y/y the previous month. The probability of a September Federal

Laurie Bailey 05:01 2025-08-15 UTC+2

EUR/USD Forecast for August 15, 2025

The euro has now reached Fibonacci time line No. 8 — and it has arrived with a pessimistic mood. Yesterday, the support level at 1.1632 was tested, and the Marlin

Laurie Bailey 05:01 2025-08-15 UTC+2

AUD/USD Forecast for August 15, 2025

After yesterday's sharp drop of more than 50 pips, it has become clear that the breakout and consolidation above the balance line (blue rectangle) was false, which now shifts

Laurie Bailey 04:53 2025-08-15 UTC+2

EUR/USD – August 14th. Friday will be decisive

On Wednesday, the EUR/USD pair continued its upward movement and consolidated above the 76.4% retracement level at 1.1695. This suggests that the euro may continue rising today toward the next

Samir Klishi 11:57 2025-08-14 UTC+2

GBP/USD – August 14th. The UK economy delivers positive news

On the hourly chart, the GBP/USD pair continued its upward move on Wednesday and reached the 100.0% retracement level at 1.3586, which borders the resistance area of 1.3611–1.3620. A rebound

Samir Klishi 11:15 2025-08-14 UTC+2

EUR/USD. Indicator Analysis on August 14, 2025

On Wednesday, the pair, moving upward, tested the 85.4% retracement level at 1.1731 (yellow dashed line) and then declined, closing the daily candle at 1.1704. Today, the price may begin

Stefan Doll 11:00 2025-08-14 UTC+2

GBP/USD. Indicator Analysis on August 14, 2025

On Wednesday, the pair, moving upward, tested the upper fractal at 1.3587 (red dashed line) and then retreated slightly, closing the daily candle at 1.3571. Today, the price may begin

Stefan Doll 10:48 2025-08-14 UTC+2

EUR/USD. The Pair May Correct Downward Amid Trump's Speech

Today, U.S. President D. Trump is scheduled to speak. Investors, already aware that he might throw in something unexpected, are reducing part of their long positions in the pair just

Pati Gani 10:03 2025-08-14 UTC+2

XAU/USD. Analysis and Forecast

The breakout above the $3358 level, where the 100-period Simple Moving Average (SMA) on the 4-hour chart is located, against the backdrop of the earlier confirmed hold above the 200-period

Irina Yanina 08:38 2025-08-14 UTC+2
Can't speak right now?
Ask your question in the chat.
Widget callback
 

Dear visitor,

Your IP address shows that you are currently located in the USA. If you are a resident of the United States, you are prohibited from using the services of InstaFintech Group including online trading, online transfers, deposit/withdrawal of funds, etc.

If you think you are seeing this message by mistake and your location is not the US, kindly proceed to the website. Otherwise, you must leave the website in order to comply with government restrictions.

Why does your IP address show your location as the USA?

  • - you are using a VPN provided by a hosting company based in the United States;
  • - your IP does not have proper WHOIS records;
  • - an error occurred in the WHOIS geolocation database.

Please confirm whether you are a US resident or not by clicking the relevant button below. If you choose the wrong option, being a US resident, you will not be able to open an account with InstaForex anyway.

We are sorry for any inconvenience caused by this message.