empty
10.08.2023 10:47 AM
EUR/USD and GBP/USD: Trading plan for beginner traders on August 10, 2023

Details of the economic calendar on August 9

In the first half of the trading week, there were no significant macroeconomic events, and no statistical data was published either in Europe, the United Kingdom, or the United States.

Analysis of the trading charts from August 9

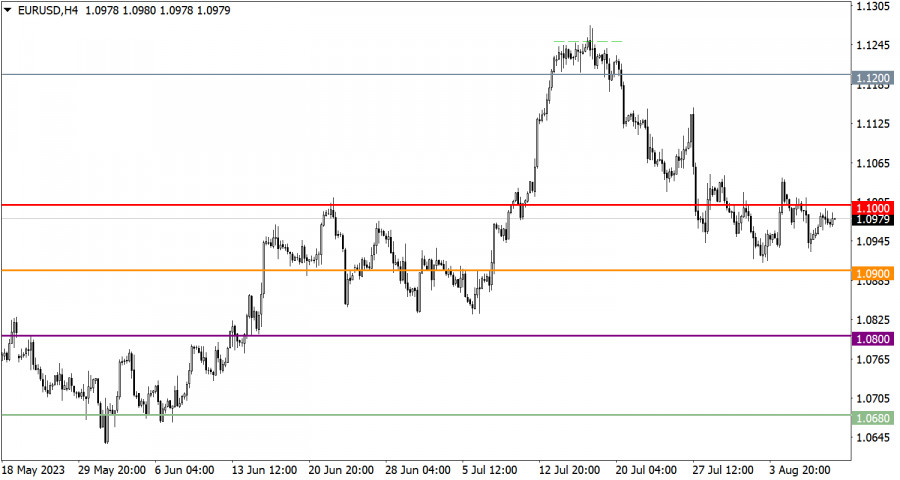
The EUR/USD exchange rate slowed down the pace of formation of the corrective movement. Instead, a rather broad sideways trend is observed, which traders analyze as a phase of regrouping of trading forces.

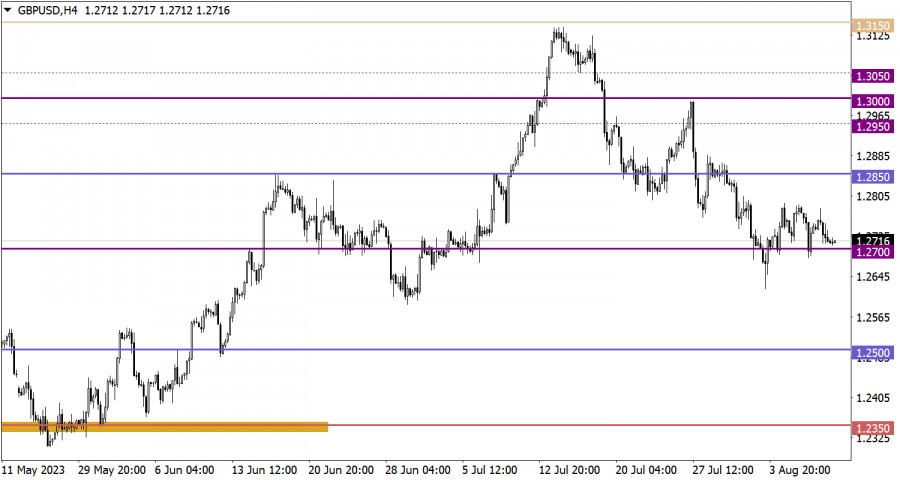
GBP/USD, despite the ongoing correction from the peak of the medium-term trend, is currently in a stagnation phase. The support level at 1.2700 plays a crucial role in this context, forming a fluctuation range between 1.2700 and 1.2780.

This image is no longer relevant

Economic Calendar for August 10

Today, investors' primary focus is on the long-awaited U.S. inflation report.

The U.S. Consumer Price Index may provide hints regarding the direction the Federal Reserve might take in its monetary policy. This becomes especially relevant after Friday's employment report raised concerns about the potential for prolonged high rates.

EUR/USD trading plan for August 10

In the current situation, a technical signal for a prolonged correction cycle will arise when the price holds below the 1.0900 mark. In this case, a subsequent increase in short positions volume might be possible. As for the growth scenario, it will become relevant if the price remains above the 1.1050 mark. Subsequent market developments might undergo a phased process of the euro's recovery, which might ultimately lead to the end of the current corrective movement.

This image is no longer relevant

GBP/USD trading plan for August 10

For the current corrective movement of the currency pair to continue, the quote must consistently remain below the 1.2700 level. Under such a condition, further movement in the direction of the price range between 1.2550 and 1.2600 is possible. However, a clear signal for an increase in long positions on the pound sterling might arise if the price holds above the 1.2800 mark. This signal could indicate the end of the current correction cycle.

This image is no longer relevant

What's on the charts

The candlestick chart type is white and black graphic rectangles with lines above and below. With a detailed analysis of each individual candle, you can see its characteristics relative to a particular time frame: opening price, closing price, intraday high and low.

Horizontal levels are price coordinates, relative to which a price may stop or reverse its trajectory. In the market, these levels are called support and resistance.

Circles and rectangles are highlighted examples where the price reversed in history. This color highlighting indicates horizontal lines that may put pressure on the asset's price in the future.

The up/down arrows are landmarks of the possible price direction in the future.

Gven Podolsky,
Analytical expert of InstaForex
© 2007-2025
Summary
Urgency
Analytic
Vladislav Tukhmenev
Start trade
Earn on cryptocurrency rate changes with InstaForex
Download MetaTrader 4 and open your first trade
  • Grand Choice
    Contest by
    InstaForex
    InstaForex always strives to help you
    fulfill your biggest dreams.
    JOIN CONTEST

Recommended Stories

How to Trade the GBP/USD Pair on August 4? Simple Tips and Trade Analysis for Beginners

Analysis of Friday's Trades 1H Chart of GBP/USD The GBP/USD pair also showed wild movements on Friday, triggered not only by labor market data, but also by unemployment figures, manufacturing

Paolo Greco 06:14 2025-08-04 UTC+2

How to Trade the EUR/USD Pair on August 4? Simple Tips and Trade Analysis for Beginners

Analysis of Friday's Trades 1H Chart of EUR/USD The EUR/USD currency pair showed strong growth on Friday, which was completely justified—just like all market movements last week. Let us recall

Paolo Greco 06:14 2025-08-04 UTC+2

Trading Recommendations and Trade Breakdown for GBP/USD on August 4: The British Pound One Step Away from Breaking the Trend

The GBP/USD currency pair also showed strong upward movement on Friday but failed to break through the trendline, the Kijun-sen line, and the 1.3307 level. Thus, the trend

Paolo Greco 03:47 2025-08-04 UTC+2

Trading Recommendations and Trade Breakdown for EUR/USD on August 4: The Trend Is Starting to Shift

The EUR/USD currency pair showed strong growth on Friday and ended up above the Kijun-sen line. Thus, from a technical standpoint, the trend has started to shift upward. At least

Paolo Greco 03:47 2025-08-04 UTC+2

How to Trade the GBP/USD Pair on August 1? Simple Tips and Trade Analysis for Beginners

Analysis of Thursday's Trades 1H Chart of GBP/USD On Thursday, the GBP/USD pair ignored the complete lack of new reasons to decline and continued moving downward by inertia. Recently

Paolo Greco 07:09 2025-08-01 UTC+2

How to Trade the EUR/USD Pair on August 1? Simple Tips and Trade Analysis for Beginners

Analysis of Thursday's Trades 1H Chart of EUR/USD The EUR/USD currency pair paused for a "break" on Thursday, which was quite expected. The macroeconomic background on Thursday was very weak

Paolo Greco 07:09 2025-08-01 UTC+2

Trading Recommendations and Trade Breakdown for GBP/USD on August 1: The Pound's Castle in the Air

The GBP/USD currency pair continued its downward movement throughout Thursday, although by that point, there were no longer any solid reasons for it. The British pound, like the euro

Paolo Greco 05:50 2025-08-01 UTC+2

Trading Recommendations and Trade Breakdown for EUR/USD on August 1: Calm Before the Storm

The EUR/USD currency pair paused on Thursday, just as we anticipated. There were no major reports or events scheduled for the day, and for once, Donald Trump took a break

Paolo Greco 05:50 2025-08-01 UTC+2

How to Trade the GBP/USD Pair on July 31? Simple Tips and Trade Analysis for Beginners

Analysis of Wednesday's Trades 1H Chart of GBP/USD On Wednesday, the GBP/USD pair also posted another decline for the same reasons as EUR/USD — a strong U.S. GDP report combined

Paolo Greco 07:09 2025-07-31 UTC+2

How to Trade the EUR/USD Pair on July 31? Simple Tips and Trade Analysis for Beginners

Analysis of Wednesday's Trades 1H Chart of EUR/USD On Wednesday, the EUR/USD currency pair continued to decline almost the entire day. This time, the U.S. dollar received strong support from

Paolo Greco 07:09 2025-07-31 UTC+2
Can't speak right now?
Ask your question in the chat.
Widget callback
 

Dear visitor,

Your IP address shows that you are currently located in the USA. If you are a resident of the United States, you are prohibited from using the services of InstaFintech Group including online trading, online transfers, deposit/withdrawal of funds, etc.

If you think you are seeing this message by mistake and your location is not the US, kindly proceed to the website. Otherwise, you must leave the website in order to comply with government restrictions.

Why does your IP address show your location as the USA?

  • - you are using a VPN provided by a hosting company based in the United States;
  • - your IP does not have proper WHOIS records;
  • - an error occurred in the WHOIS geolocation database.

Please confirm whether you are a US resident or not by clicking the relevant button below. If you choose the wrong option, being a US resident, you will not be able to open an account with InstaForex anyway.

We are sorry for any inconvenience caused by this message.