

signal strength 1 of 5
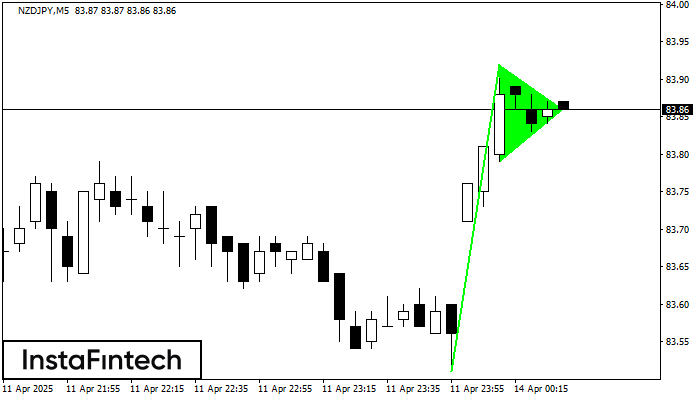
The Bullish pennant signal – Trading instrument NZDJPY M5, continuation pattern. Forecast: it is possible to set up a buy position above the pattern’s high of 83.92, with the prospect of the next move being a projection of the flagpole height.
The M5 and M15 time frames may have more false entry points.
یہ بھی دیکھیں
- All
- Double Top
- Flag
- Head and Shoulders
- Pennant
- Rectangle
- Triangle
- Triple top
- All
- #AAPL
- #AMZN
- #Bitcoin
- #EBAY
- #FB
- #GOOG
- #INTC
- #KO
- #MA
- #MCD
- #MSFT
- #NTDOY
- #PEP
- #TSLA
- #TWTR
- AUDCAD
- AUDCHF
- AUDJPY
- AUDUSD
- EURCAD
- EURCHF
- EURGBP
- EURJPY
- EURNZD
- EURRUB
- EURUSD
- GBPAUD
- GBPCHF
- GBPJPY
- GBPUSD
- GOLD
- NZDCAD
- NZDCHF
- NZDJPY
- NZDUSD
- SILVER
- USDCAD
- USDCHF
- USDJPY
- USDRUB
- All
- M5
- M15
- M30
- H1
- D1
- All
- Buy
- Sale
- All
- 1
- 2
- 3
- 4
- 5
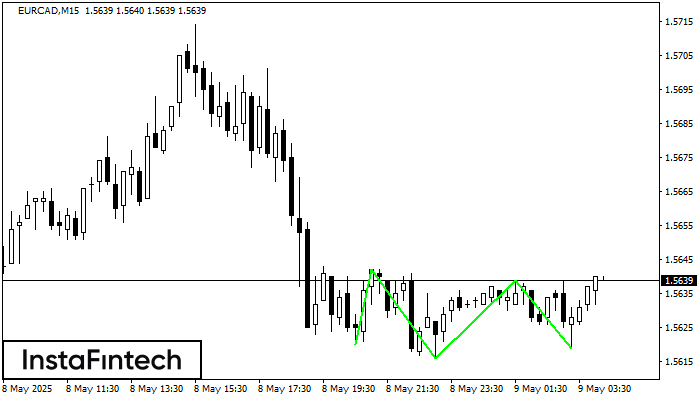
The Triple Bottom pattern has formed on the chart of EURCAD M15. Features of the pattern: The lower line of the pattern has coordinates 1.5642 with the upper limit 1.5642/1.5639
The M5 and M15 time frames may have more false entry points.
Open chart in a new window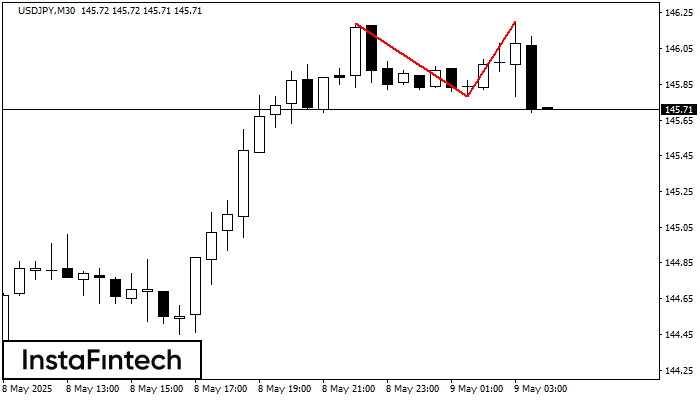
The Double Top pattern has been formed on USDJPY M30. It signals that the trend has been changed from upwards to downwards. Probably, if the base of the pattern 145.78
Open chart in a new window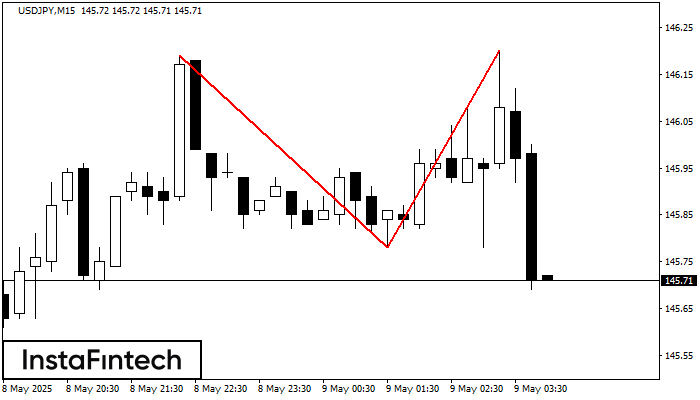
The Double Top pattern has been formed on USDJPY M15. It signals that the trend has been changed from upwards to downwards. Probably, if the base of the pattern 145.78
The M5 and M15 time frames may have more false entry points.
Open chart in a new window


