


signal strength 2 of 5
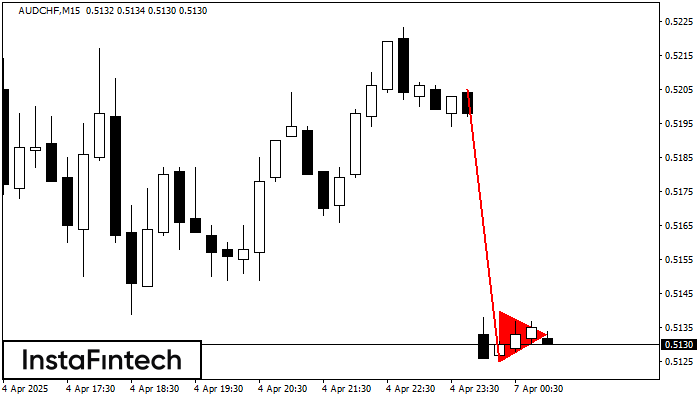
The Bearish pennant pattern has formed on the AUDCHF M15 chart. It signals potential continuation of the existing trend. Specifications: the pattern’s bottom has the coordinate of 0.5125; the projection of the flagpole height is equal to 80 pips. In case the price breaks out the pattern’s bottom of 0.5125, the downtrend is expected to continue for further level 0.5102.
The M5 and M15 time frames may have more false entry points.
یہ بھی دیکھیں
- All
- Double Top
- Flag
- Head and Shoulders
- Pennant
- Rectangle
- Triangle
- Triple top
- All
- #AAPL
- #AMZN
- #Bitcoin
- #EBAY
- #FB
- #GOOG
- #INTC
- #KO
- #MA
- #MCD
- #MSFT
- #NTDOY
- #PEP
- #TSLA
- #TWTR
- AUDCAD
- AUDCHF
- AUDJPY
- AUDUSD
- EURCAD
- EURCHF
- EURGBP
- EURJPY
- EURNZD
- EURRUB
- EURUSD
- GBPAUD
- GBPCHF
- GBPJPY
- GBPUSD
- GOLD
- NZDCAD
- NZDCHF
- NZDJPY
- NZDUSD
- SILVER
- USDCAD
- USDCHF
- USDJPY
- USDRUB
- All
- M5
- M15
- M30
- H1
- D1
- All
- Buy
- Sale
- All
- 1
- 2
- 3
- 4
- 5
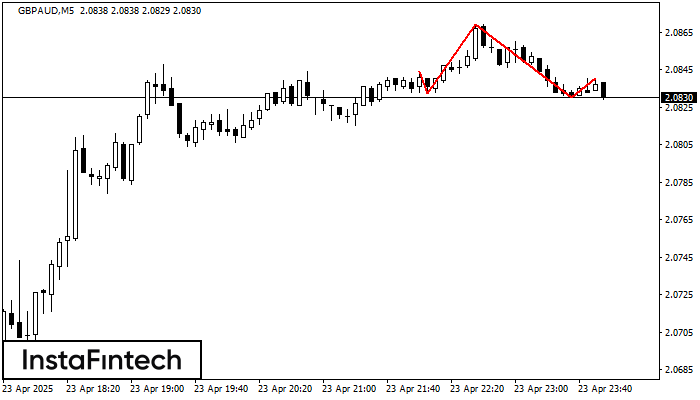
According to the chart of M5, GBPAUD formed the Head and Shoulders pattern. The Head’s top is set at 2.0869 while the median line of the Neck is found
The M5 and M15 time frames may have more false entry points.
Open chart in a new window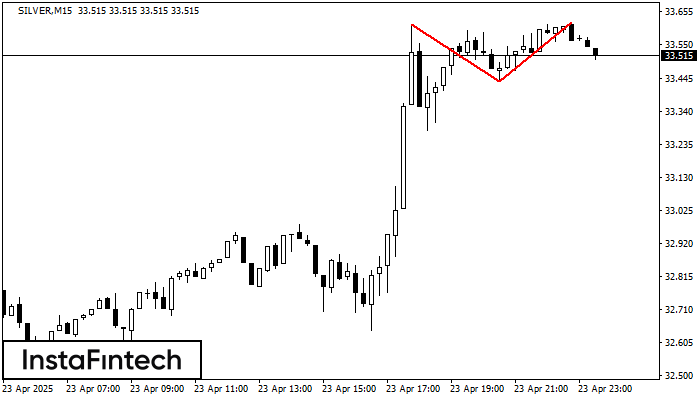
On the chart of SILVER M15 the Double Top reversal pattern has been formed. Characteristics: the upper boundary 33.62; the lower boundary 33.44; the width of the pattern 185 points
The M5 and M15 time frames may have more false entry points.
Open chart in a new window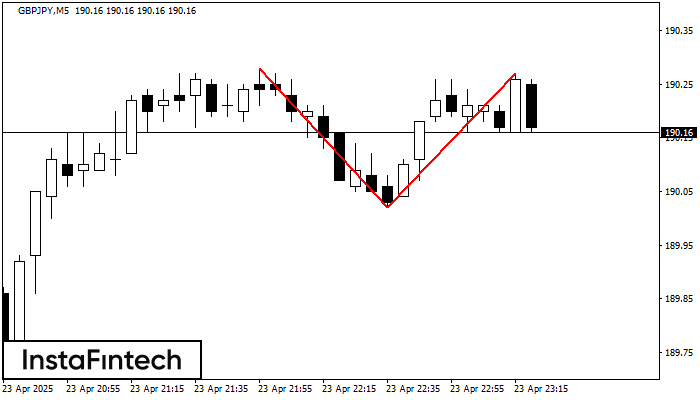
On the chart of GBPJPY M5 the Double Top reversal pattern has been formed. Characteristics: the upper boundary 190.27; the lower boundary 190.02; the width of the pattern 25 points
The M5 and M15 time frames may have more false entry points.
Open chart in a new window


