

signal strength 2 of 5

According to the chart of M15, #FB formed the Inverse Head and Shoulder pattern. The Head’s top is set at 485.03 while the median line of the Neck is found at 479.95/482.45. The formation of the Inverse Head and Shoulder pattern evidently signals a reversal of the downward trend. In other words, in case the scenario comes true, the price of #FB will go towards 485.26
The M5 and M15 time frames may have more false entry points.
See Also
- All
- Double Top
- Flag
- Head and Shoulders
- Pennant
- Rectangle
- Triangle
- Triple top
- All
- #AAPL
- #AMZN
- #Bitcoin
- #EBAY
- #FB
- #GOOG
- #INTC
- #KO
- #MA
- #MCD
- #MSFT
- #NTDOY
- #PEP
- #TSLA
- #TWTR
- AUDCAD
- AUDCHF
- AUDJPY
- AUDUSD
- EURCAD
- EURCHF
- EURGBP
- EURJPY
- EURNZD
- EURRUB
- EURUSD
- GBPAUD
- GBPCHF
- GBPJPY
- GBPUSD
- GOLD
- NZDCAD
- NZDCHF
- NZDJPY
- NZDUSD
- SILVER
- USDCAD
- USDCHF
- USDJPY
- USDRUB
- All
- M5
- M15
- M30
- H1
- D1
- All
- Buy
- Sale
- All
- 1
- 2
- 3
- 4
- 5
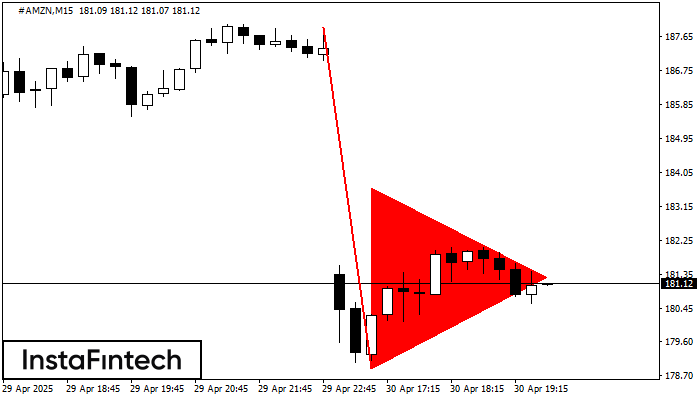
The Bearish pennant pattern has formed on the #AMZN M15 chart. The pattern signals continuation of the downtrend in case the pennant’s low of 178.89 is broken through. Recommendations: Place
The M5 and M15 time frames may have more false entry points.
Open chart in a new window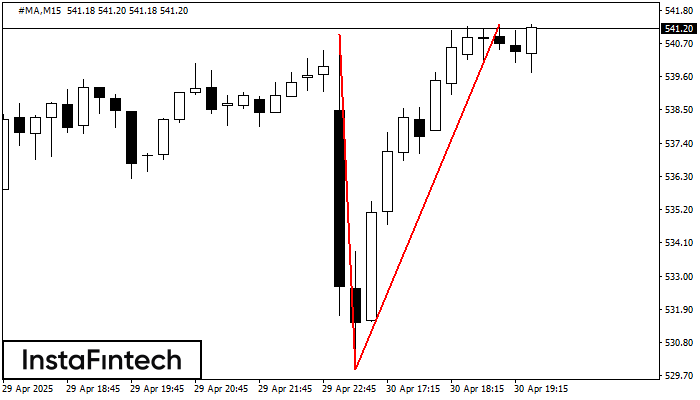
The Double Top reversal pattern has been formed on #MA M15. Characteristics: the upper boundary 540.99; the lower boundary 529.93; the width of the pattern is 1140 points. Sell trades
The M5 and M15 time frames may have more false entry points.
Open chart in a new window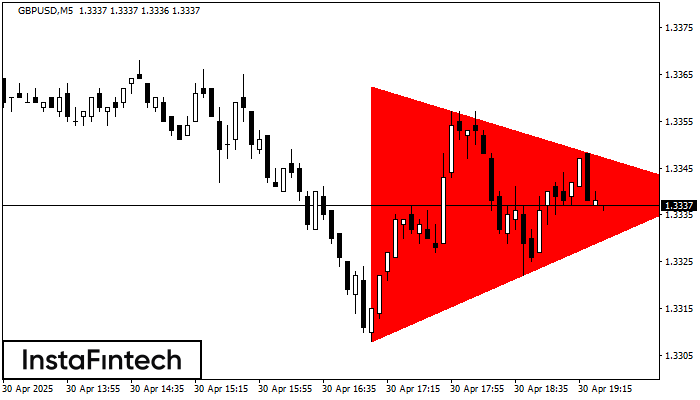
According to the chart of M5, GBPUSD formed the Bearish Symmetrical Triangle pattern. Description: The lower border is 1.3308/1.3340 and upper border is 1.3362/1.3340. The pattern width is measured
The M5 and M15 time frames may have more false entry points.
Open chart in a new window


