

signal strength 1 of 5

On the chart of the NZDUSD M5 trading instrument, the Triple Top pattern that signals a trend change has formed. It is possible that after formation of the third peak, the price will try to break through the resistance level 0.5542, where we advise to open a trading position for sale. Take profit is the projection of the pattern’s width, which is 16 points.
The M5 and M15 time frames may have more false entry points.
See Also
- All
- Double Top
- Flag
- Head and Shoulders
- Pennant
- Rectangle
- Triangle
- Triple top
- All
- #AAPL
- #AMZN
- #Bitcoin
- #EBAY
- #FB
- #GOOG
- #INTC
- #KO
- #MA
- #MCD
- #MSFT
- #NTDOY
- #PEP
- #TSLA
- #TWTR
- AUDCAD
- AUDCHF
- AUDJPY
- AUDUSD
- EURCAD
- EURCHF
- EURGBP
- EURJPY
- EURNZD
- EURRUB
- EURUSD
- GBPAUD
- GBPCHF
- GBPJPY
- GBPUSD
- GOLD
- NZDCAD
- NZDCHF
- NZDJPY
- NZDUSD
- SILVER
- USDCAD
- USDCHF
- USDJPY
- USDRUB
- All
- M5
- M15
- M30
- H1
- D1
- All
- Buy
- Sale
- All
- 1
- 2
- 3
- 4
- 5

En el gráfico de NZDCAD D1 el patrón de reversión Doble Techo ha sido formado. Características: límite superior 0.8316; límite inferior 0.7826; el ancho del patrón 490 puntos. La señal
Open chart in a new window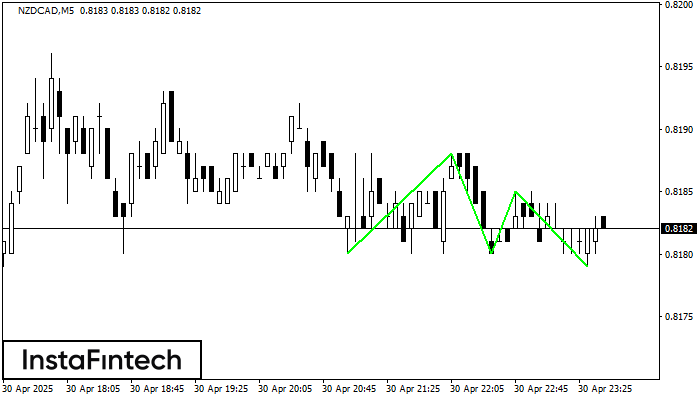
El patrón Triple Piso ha sido formado en NZDCAD M5. Este tiene las siguientes características: nivel de resistencia 0.8188/0.8185; nivel de soporte 0.8180/0.8179; el ancho es 8 puntos. En caso
Los marcos de tiempo M5 y M15 pueden tener más puntos de entrada falsos.
Open chart in a new window
Según el gráfico de M15, el #Bitcoin formó el patrón Triángulo Simétrico Alcista. El límite inferior del patrón toca las coordenadas 92482.78/94081.93 donde el límite superior cruza 95186.64/94081.93
Los marcos de tiempo M5 y M15 pueden tener más puntos de entrada falsos.
Open chart in a new window


