empty
was formed on 08.04 at 12:30:45 (UTC+0)
signal strength 4 of 5
Bearish Symmetrical Triangle AUDCHF H1

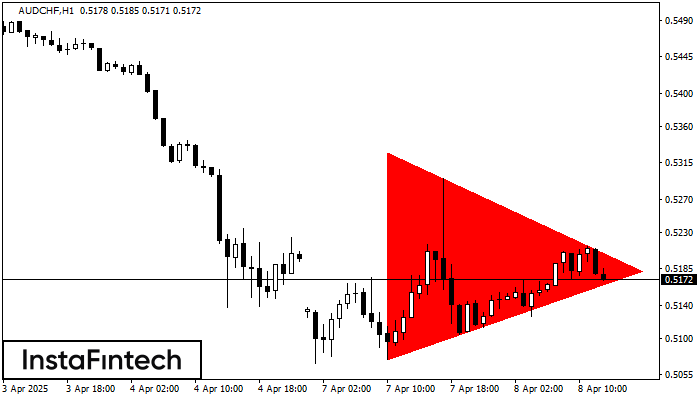
According to the chart of H1, AUDCHF formed the Bearish Symmetrical Triangle pattern. Description: The lower border is 0.5074/0.5182 and upper border is 0.5328/0.5182. The pattern width is measured on the chart at -254 pips. The formation of the Bearish Symmetrical Triangle pattern evidently signals a continuation of the downward trend. In other words, if the scenario comes true and AUDCHF breaches the lower border, the price could continue its move toward 0.5142.

Figure
  • All
  • Double Top
  • Flag
  • Head and Shoulders
  • Pennant
  • Rectangle
  • Triangle
  • Triple top
Instrument
  • All
  • #AAPL
  • #AMZN
  • #Bitcoin
  • #EBAY
  • #FB
  • #GOOG
  • #INTC
  • #KO
  • #MA
  • #MCD
  • #MSFT
  • #NTDOY
  • #PEP
  • #TSLA
  • #TWTR
  • AUDCAD
  • AUDCHF
  • AUDJPY
  • AUDUSD
  • EURCAD
  • EURCHF
  • EURGBP
  • EURJPY
  • EURNZD
  • EURRUB
  • EURUSD
  • GBPAUD
  • GBPCHF
  • GBPJPY
  • GBPUSD
  • GOLD
  • NZDCAD
  • NZDCHF
  • NZDJPY
  • NZDUSD
  • SILVER
  • USDCAD
  • USDCHF
  • USDJPY
  • USDRUB
Timeframe
  • All
  • M5
  • M15
  • M30
  • H1
  • D1
Trend
  • All
  • Buy
  • Sale
Signal Strength
  • All
  • 1
  • 2
  • 3
  • 4
  • 5
Tam giác Cân Giảm
was formed on 24.06 at 20:05:45 (UTC+0)
signal strength 1 of 5
Tam giác Cân Giảm AUDUSD M5

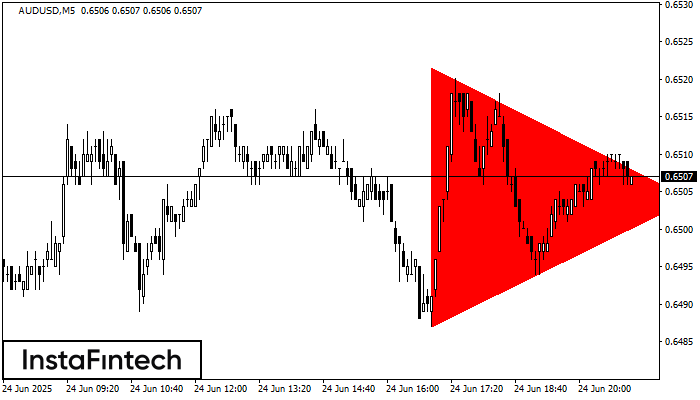
Theo biểu đồ của M5, AUDUSD đã hình thành mô hình Tam giác Cân Giảm. Khuyến nghị giao dịch: Việc vi phạm biên giới thấp hơn 0.6487 có khả năng

Khung thời gian M5 và M15 có thể có nhiều điểm vào lệnh sai hơn.

Open chart in a new window
Hình chữ nhật giảm
was formed on 24.06 at 20:03:19 (UTC+0)
signal strength 3 of 5
Hình chữ nhật giảm EURGBP M30

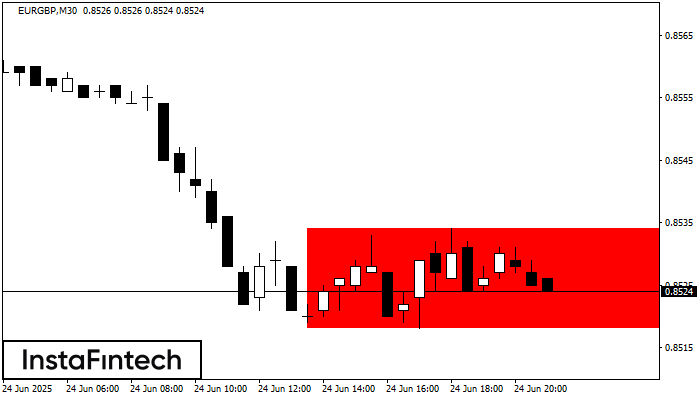
Theo biểu đồ của M30, EURGBP đã hình thành Hình chữ nhật giảm, cái mà là mô hình của sự tiếp tục xu hướng. Mô hình được chứa trong

Open chart in a new window
Hình chữ nhật giảm
was formed on 24.06 at 20:00:24 (UTC+0)
signal strength 2 of 5
Hình chữ nhật giảm EURGBP M15

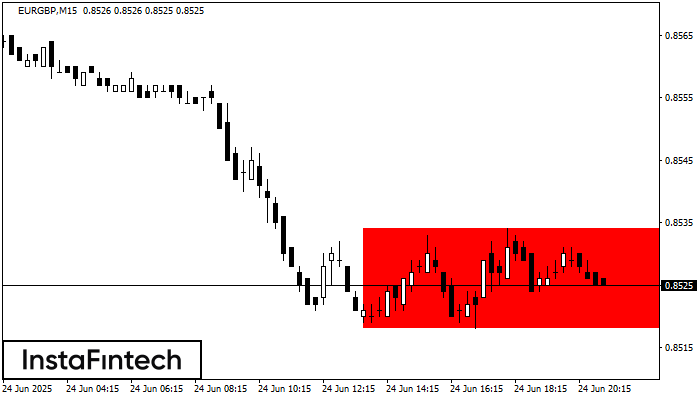
Theo biểu đồ của M15, EURGBP đã hình thành Hình chữ nhật giảm, cái mà là mô hình của sự tiếp tục xu hướng. Mô hình được chứa trong

Khung thời gian M5 và M15 có thể có nhiều điểm vào lệnh sai hơn.

Open chart in a new window
Can't speak right now?
Ask your question in the chat.
Widget callback
 

Dear visitor,

Your IP address shows that you are currently located in the USA. If you are a resident of the United States, you are prohibited from using the services of InstaFintech Group including online trading, online transfers, deposit/withdrawal of funds, etc.

If you think you are seeing this message by mistake and your location is not the US, kindly proceed to the website. Otherwise, you must leave the website in order to comply with government restrictions.

Why does your IP address show your location as the USA?

  • - you are using a VPN provided by a hosting company based in the United States;
  • - your IP does not have proper WHOIS records;
  • - an error occurred in the WHOIS geolocation database.

Please confirm whether you are a US resident or not by clicking the relevant button below. If you choose the wrong option, being a US resident, you will not be able to open an account with InstaForex anyway.

We are sorry for any inconvenience caused by this message.