


signal strength 1 of 5
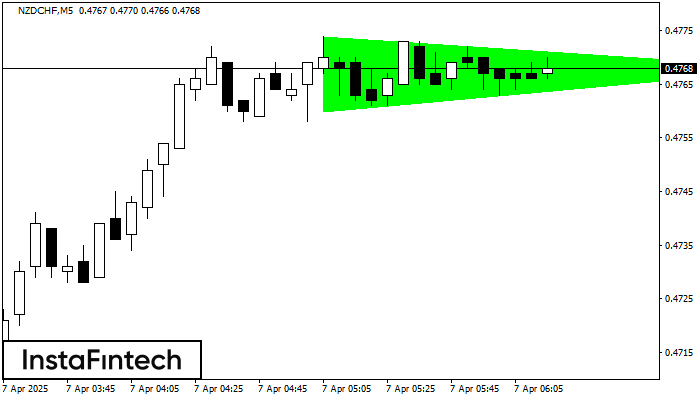
According to the chart of M5, NZDCHF formed the Bullish Symmetrical Triangle pattern. Description: This is the pattern of a trend continuation. 0.4774 and 0.4760 are the coordinates of the upper and lower borders respectively. The pattern width is measured on the chart at 14 pips. Outlook: If the upper border 0.4774 is broken, the price is likely to continue its move by 0.4783.
The M5 and M15 time frames may have more false entry points.
See Also
- All
- Double Top
- Flag
- Head and Shoulders
- Pennant
- Rectangle
- Triangle
- Triple top
- All
- #AAPL
- #AMZN
- #Bitcoin
- #EBAY
- #FB
- #GOOG
- #INTC
- #KO
- #MA
- #MCD
- #MSFT
- #NTDOY
- #PEP
- #TSLA
- #TWTR
- AUDCAD
- AUDCHF
- AUDJPY
- AUDUSD
- EURCAD
- EURCHF
- EURGBP
- EURJPY
- EURNZD
- EURRUB
- EURUSD
- GBPAUD
- GBPCHF
- GBPJPY
- GBPUSD
- GOLD
- NZDCAD
- NZDCHF
- NZDJPY
- NZDUSD
- SILVER
- USDCAD
- USDCHF
- USDJPY
- USDRUB
- All
- M5
- M15
- M30
- H1
- D1
- All
- Buy
- Sale
- All
- 1
- 2
- 3
- 4
- 5
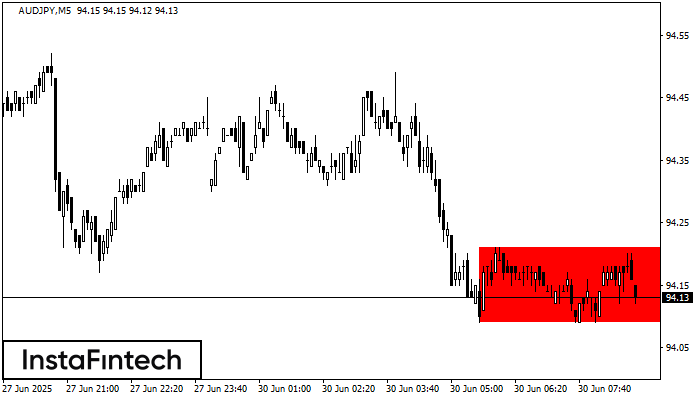
По AUDJPY M5 сформировалась фигура - «Прямоугольник». Фигура данного типа относится к тому типу продолжения тренда, который имеет два уровня: Сопротивление 94.21; Поддержка 94.09. В случае пробоя уровня поддержки 94.09
Таймфреймы М5 и М15 могут иметь больше ложных точек входа.
Открыть график инструмента в новом окне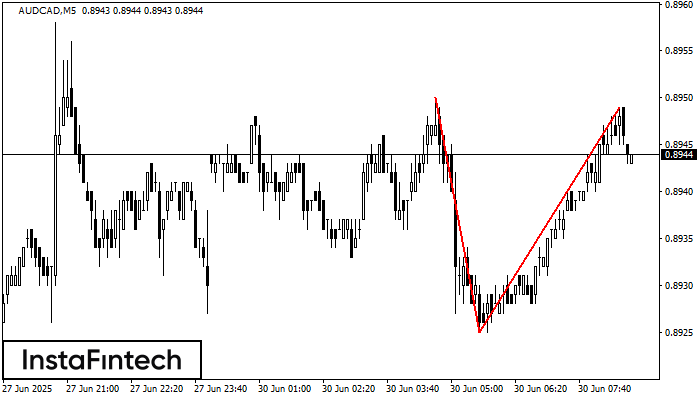
На торговом графике AUDCAD M5 сформировалась разворотная фигура «Двойная вершина». Характеристика: Верхняя граница 0.8949; Нижняя граница 0.8925; Ширина фигуры 24 пунктов. Сигнал: Пробой нижней границы 0.8925 приведет к дальнейшему нисходящему
Таймфреймы М5 и М15 могут иметь больше ложных точек входа.
Открыть график инструмента в новом окне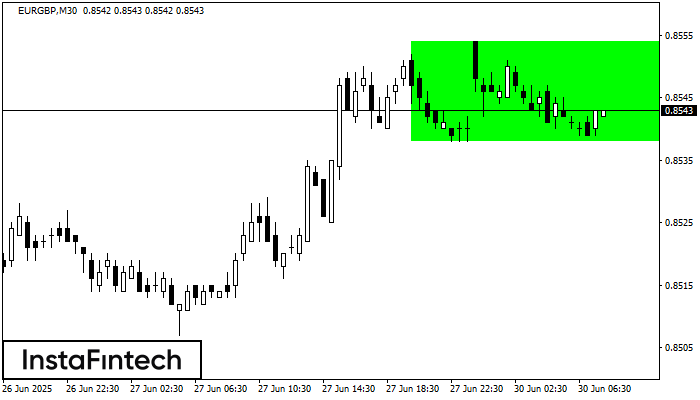
Сформирована фигура «Прямоугольник» на графике EURGBP M30. Тип фигуры: Продолжение тренда; Границы: Верхняя 0.8554, Нижняя 0.8538; Сигнал: позицию на покупку следует открывать выше верхней границы прямоугольника 0.8554
Открыть график инструмента в новом окне


