


signal strength 1 of 5

The Bearish Flag pattern has been formed on the chart AUDCAD M5 which signals that the downward trend will continue. If the price breaks below the low at 0.8881, then it is most likely to move further downwards. The price will likely move by the number of points which equals the length of the flag pole (10 points).
The M5 and M15 time frames may have more false entry points.
- All
- Double Top
- Flag
- Head and Shoulders
- Pennant
- Rectangle
- Triangle
- Triple top
- All
- #AAPL
- #AMZN
- #Bitcoin
- #EBAY
- #FB
- #GOOG
- #INTC
- #KO
- #MA
- #MCD
- #MSFT
- #NTDOY
- #PEP
- #TSLA
- #TWTR
- AUDCAD
- AUDCHF
- AUDJPY
- AUDUSD
- EURCAD
- EURCHF
- EURGBP
- EURJPY
- EURNZD
- EURRUB
- EURUSD
- GBPAUD
- GBPCHF
- GBPJPY
- GBPUSD
- GOLD
- NZDCAD
- NZDCHF
- NZDJPY
- NZDUSD
- SILVER
- USDCAD
- USDCHF
- USDJPY
- USDRUB
- All
- M5
- M15
- M30
- H1
- D1
- All
- Buy
- Sale
- All
- 1
- 2
- 3
- 4
- 5
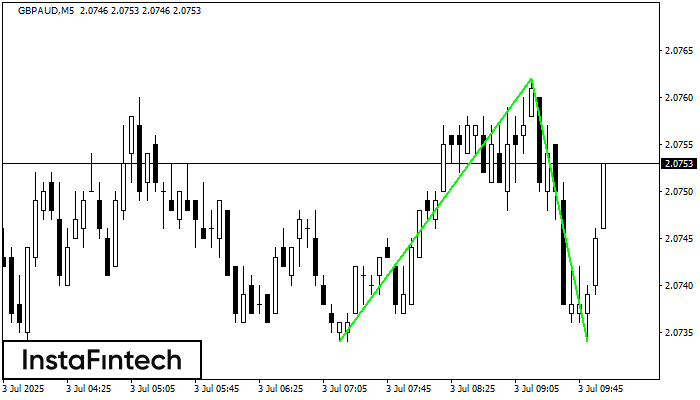
The Double Bottom pattern has been formed on GBPAUD M5. Characteristics: the support level 2.0734; the resistance level 2.0762; the width of the pattern 28 points. If the resistance level
The M5 and M15 time frames may have more false entry points.
Открыть график инструмента в новом окне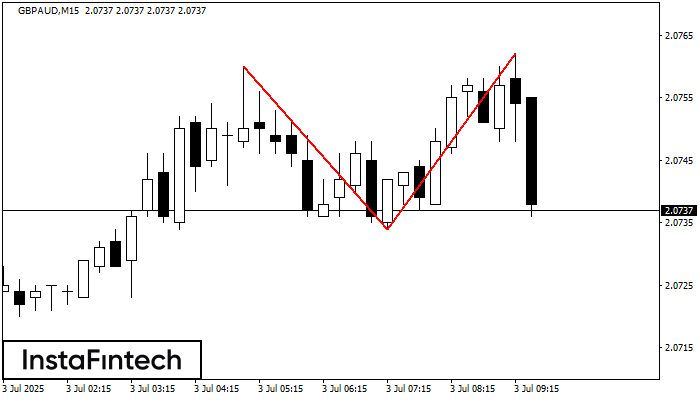
The Double Top reversal pattern has been formed on GBPAUD M15. Characteristics: the upper boundary 2.0760; the lower boundary 2.0734; the width of the pattern is 28 points. Sell trades
The M5 and M15 time frames may have more false entry points.
Открыть график инструмента в новом окне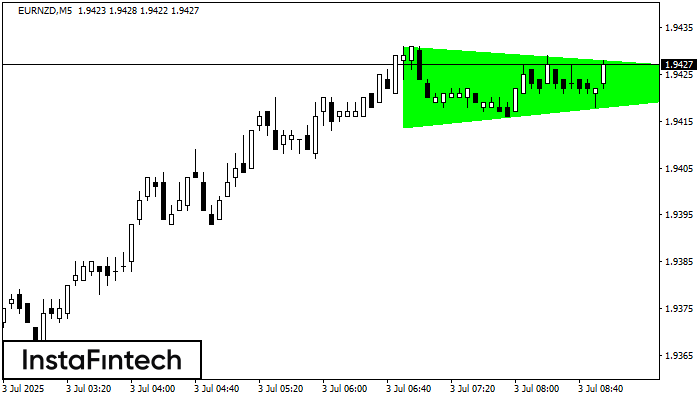
According to the chart of M5, EURNZD formed the Bullish Symmetrical Triangle pattern. The lower border of the pattern touches the coordinates 1.9414/1.9424 whereas the upper border goes across 1.9431/1.9424
The M5 and M15 time frames may have more false entry points.
Открыть график инструмента в новом окне


