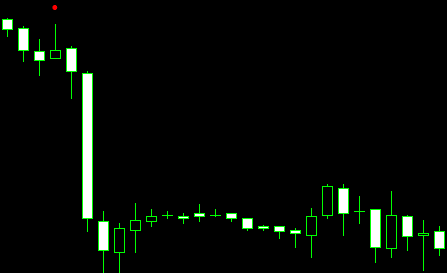
A trader should wait for the signal confirming the pattern formation.
The Downside Tasuki Gap candlestick is formed on a chart when a trading session opens below the opening level of a white candle. Then the session closes below the low of the previous candle. If the opening price is above the closing price of the black candle, and the closing price is above its high, it is an opposite scenario. The Tasuki Gap is characterized by the tasuki candle formation after a gap alongside the current trade.
The Upside Tasuki Gap is the white candle that has gapped above the previous candle. This candle is followed by a black candle that closes within the gap. The gap between the first and the second candles should remain unfilled.
It is recommended to place a long position after the last day close. An opposite approach is used in case of the Downside Tasuki Gap.
Features
1. A trend develops and there is a gap between two candlesticks of the same color.
2. The color of the first two candles shows the direction of the main trend.
3. The candle of the third day is colored differently and opens within the candlestick of the second day.
4. The third day closes inside the gap, but the gap is not fully closed.
Formation
A trader should follow the trend in the direction of the gap. The third day, which is the day of correction, closes the gap and the previous trend continues. This moment should be considered as a chance to fix profits temporarily.
If the gap is not completely filled or closed, the previous trend should resume. The gap usually gives support and resistance levels. If the gap is filled quickly, it probably does not provide needed analytical information.
The color of the first candlestick is not as important as the color of the second and the third ones. However, it is better when the first and second days have the same color; it strongly supports trend continuation.
Development
The Upside Tasuki Gap becomes a long white candlestick in the lower price range. The reduced pattern is usually a white candle, often bullish. The Downside Tasuki Gap is reduced to a long black candle, usually bearish. It is recommended to wait until the pattern confirmation.
Similar patterns
The tasuki candles are an opposite of the Piercing Line and Dark Cloud Cover reversal patterns. The Upside/Downside Tasuki Gap chart formations have similar features with the Upside/Downside Gap Three Methods.


