

signal strength 1 of 5
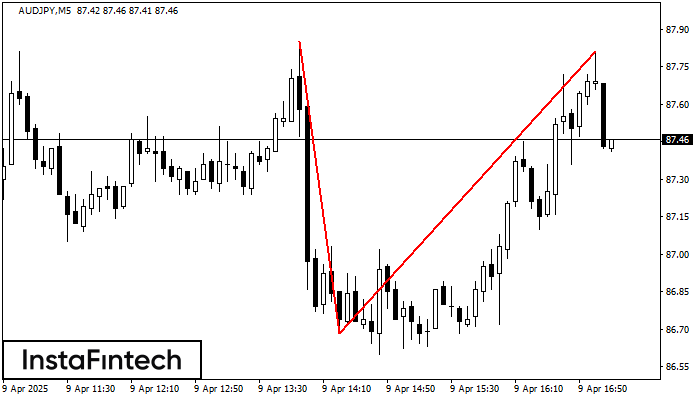
On the chart of AUDJPY M5 the Double Top reversal pattern has been formed. Characteristics: the upper boundary 87.81; the lower boundary 86.68; the width of the pattern 113 points. The signal: a break of the lower boundary will cause continuation of the downward trend targeting the 86.53 level.
The M5 and M15 time frames may have more false entry points.
Juga lihat
- All
- Double Top
- Flag
- Head and Shoulders
- Pennant
- Rectangle
- Triangle
- Triple top
- All
- #AAPL
- #AMZN
- #Bitcoin
- #EBAY
- #FB
- #GOOG
- #INTC
- #KO
- #MA
- #MCD
- #MSFT
- #NTDOY
- #PEP
- #TSLA
- #TWTR
- AUDCAD
- AUDCHF
- AUDJPY
- AUDUSD
- EURCAD
- EURCHF
- EURGBP
- EURJPY
- EURNZD
- EURRUB
- EURUSD
- GBPAUD
- GBPCHF
- GBPJPY
- GBPUSD
- GOLD
- NZDCAD
- NZDCHF
- NZDJPY
- NZDUSD
- SILVER
- USDCAD
- USDCHF
- USDJPY
- USDRUB
- All
- M5
- M15
- M30
- H1
- D1
- All
- Buy
- Sale
- All
- 1
- 2
- 3
- 4
- 5
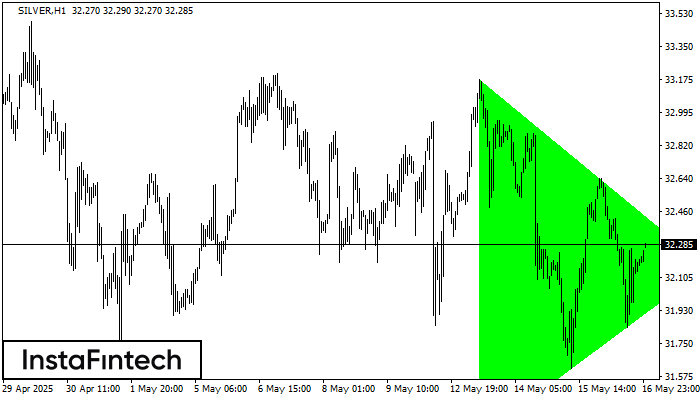
According to the chart of H1, SILVER formed the Bullish Symmetrical Triangle pattern, which signals the trend will continue. Description. The upper border of the pattern touches the coordinates 33.17/32.16
Open chart in a new window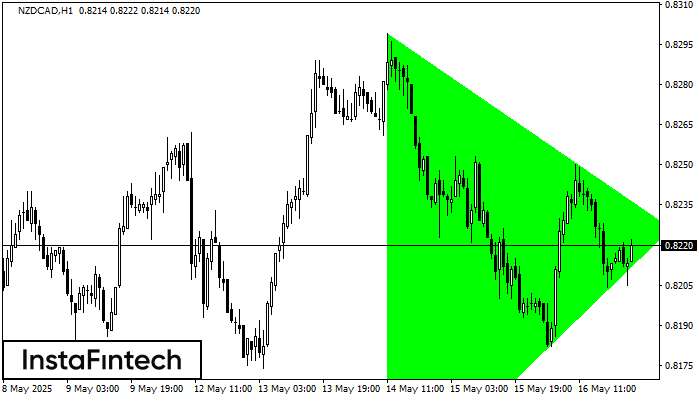
According to the chart of H1, NZDCAD formed the Bullish Symmetrical Triangle pattern, which signals the trend will continue. Description. The upper border of the pattern touches the coordinates 0.8299/0.8226
Open chart in a new window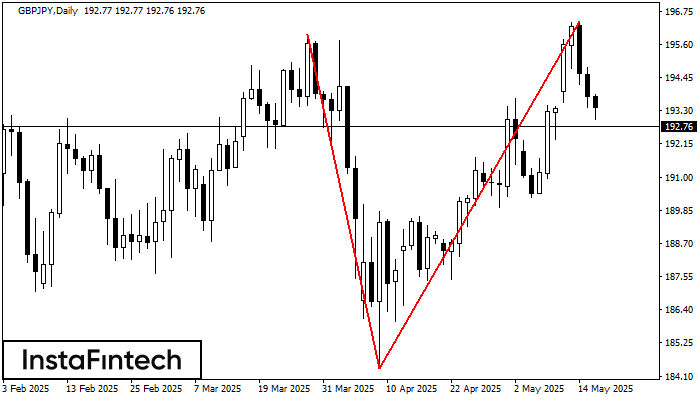
The Double Top reversal pattern has been formed on GBPJPY D1. Characteristics: the upper boundary 195.94; the lower boundary 184.35; the width of the pattern is 1203 points. Sell trades
Open chart in a new window


