


signal strength 3 of 5
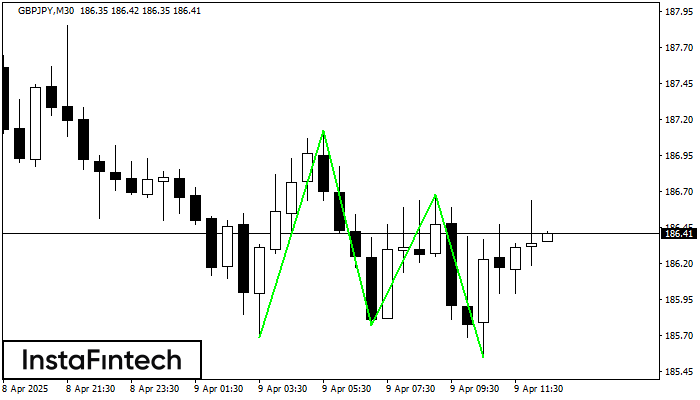
The Triple Bottom pattern has formed on the chart of GBPJPY M30. Features of the pattern: The lower line of the pattern has coordinates 187.12 with the upper limit 187.12/186.68, the projection of the width is 143 points. The formation of the Triple Bottom pattern most likely indicates a change in the trend from downward to upward. This means that in the event of a breakdown of the resistance level 185.69, the price is most likely to continue the upward movement.
Juga lihat
- All
- Double Top
- Flag
- Head and Shoulders
- Pennant
- Rectangle
- Triangle
- Triple top
- All
- #AAPL
- #AMZN
- #Bitcoin
- #EBAY
- #FB
- #GOOG
- #INTC
- #KO
- #MA
- #MCD
- #MSFT
- #NTDOY
- #PEP
- #TSLA
- #TWTR
- AUDCAD
- AUDCHF
- AUDJPY
- AUDUSD
- EURCAD
- EURCHF
- EURGBP
- EURJPY
- EURNZD
- EURRUB
- EURUSD
- GBPAUD
- GBPCHF
- GBPJPY
- GBPUSD
- GOLD
- NZDCAD
- NZDCHF
- NZDJPY
- NZDUSD
- SILVER
- USDCAD
- USDCHF
- USDJPY
- USDRUB
- All
- M5
- M15
- M30
- H1
- D1
- All
- Buy
- Sale
- All
- 1
- 2
- 3
- 4
- 5
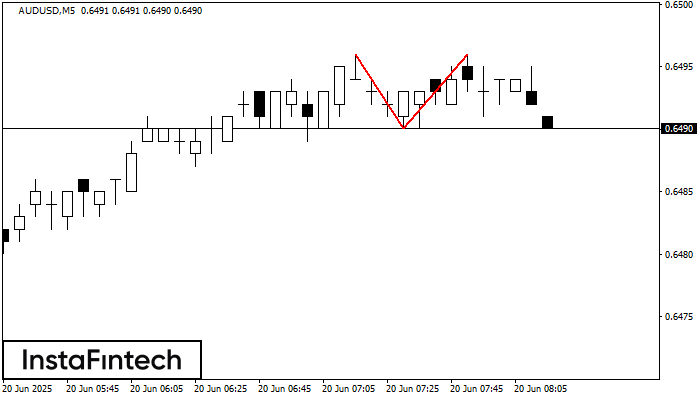
The Double Top pattern has been formed on AUDUSD M5. It signals that the trend has been changed from upwards to downwards. Probably, if the base of the pattern 0.6490
The M5 and M15 time frames may have more false entry points.
Open chart in a new window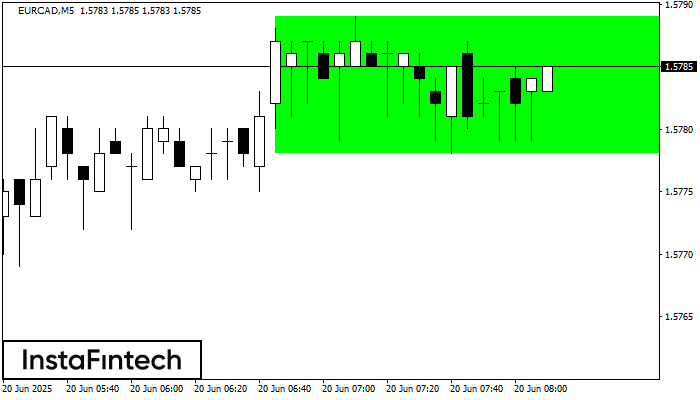
According to the chart of M5, EURCAD formed the Bullish Rectangle which is a pattern of a trend continuation. The pattern is contained within the following borders: the lower border
The M5 and M15 time frames may have more false entry points.
Open chart in a new window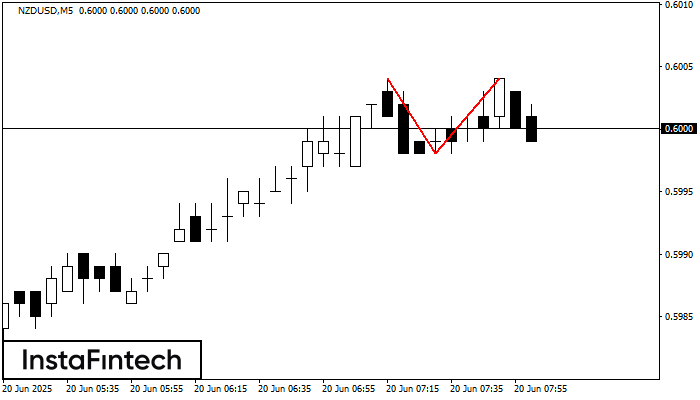
On the chart of NZDUSD M5 the Double Top reversal pattern has been formed. Characteristics: the upper boundary 0.6004; the lower boundary 0.5998; the width of the pattern 6 points
The M5 and M15 time frames may have more false entry points.
Open chart in a new window


