


signal strength 1 of 5
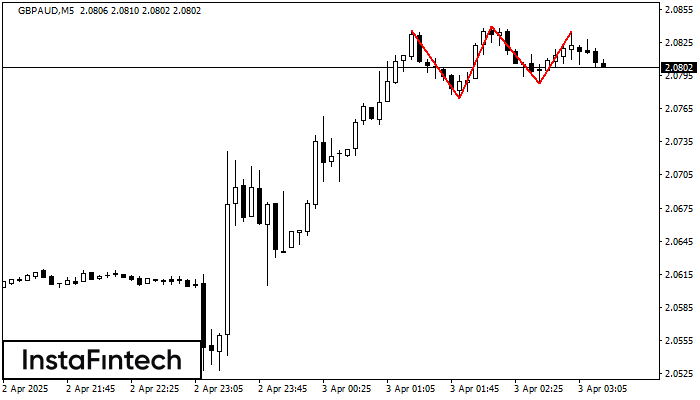
The Triple Top pattern has formed on the chart of the GBPAUD M5 trading instrument. It is a reversal pattern featuring the following characteristics: resistance level 1, support level -14, and pattern’s width 62. Forecast If the price breaks through the support level 2.0774, it is likely to move further down to 2.0825.
The M5 and M15 time frames may have more false entry points.
Juga lihat
- All
- Double Top
- Flag
- Head and Shoulders
- Pennant
- Rectangle
- Triangle
- Triple top
- All
- #AAPL
- #AMZN
- #Bitcoin
- #EBAY
- #FB
- #GOOG
- #INTC
- #KO
- #MA
- #MCD
- #MSFT
- #NTDOY
- #PEP
- #TSLA
- #TWTR
- AUDCAD
- AUDCHF
- AUDJPY
- AUDUSD
- EURCAD
- EURCHF
- EURGBP
- EURJPY
- EURNZD
- EURRUB
- EURUSD
- GBPAUD
- GBPCHF
- GBPJPY
- GBPUSD
- GOLD
- NZDCAD
- NZDCHF
- NZDJPY
- NZDUSD
- SILVER
- USDCAD
- USDCHF
- USDJPY
- USDRUB
- All
- M5
- M15
- M30
- H1
- D1
- All
- Buy
- Sale
- All
- 1
- 2
- 3
- 4
- 5
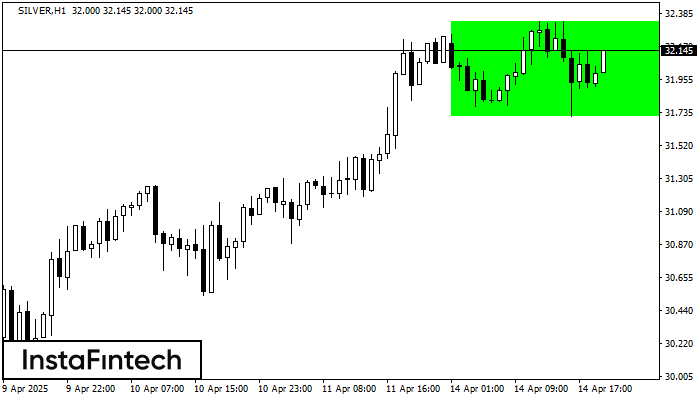
According to the chart of H1, SILVER formed the Bullish Rectangle. The pattern indicates a trend continuation. The upper border is 32.34, the lower border is 31.71. The signal means
Open chart in a new window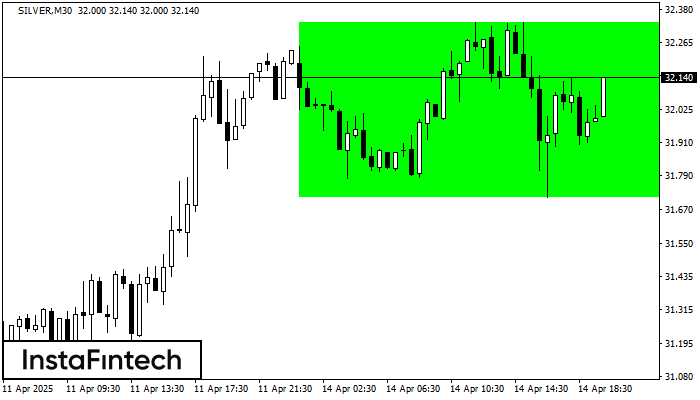
According to the chart of M30, SILVER formed the Bullish Rectangle. The pattern indicates a trend continuation. The upper border is 32.34, the lower border is 31.71. The signal means
Open chart in a new window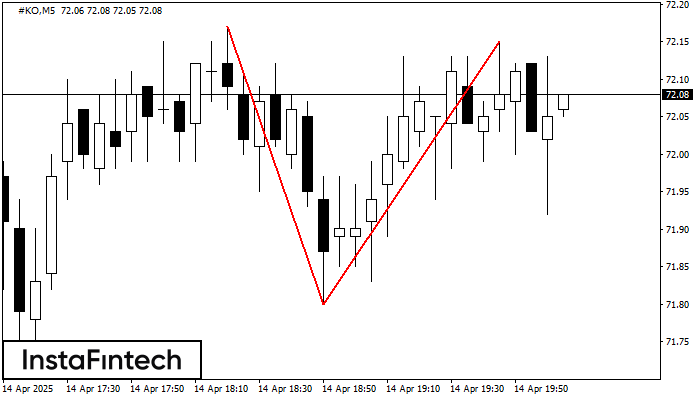
The Double Top pattern has been formed on #KO M5. It signals that the trend has been changed from upwards to downwards. Probably, if the base of the pattern 71.80
The M5 and M15 time frames may have more false entry points.
Open chart in a new window


