

signal strength 1 of 5
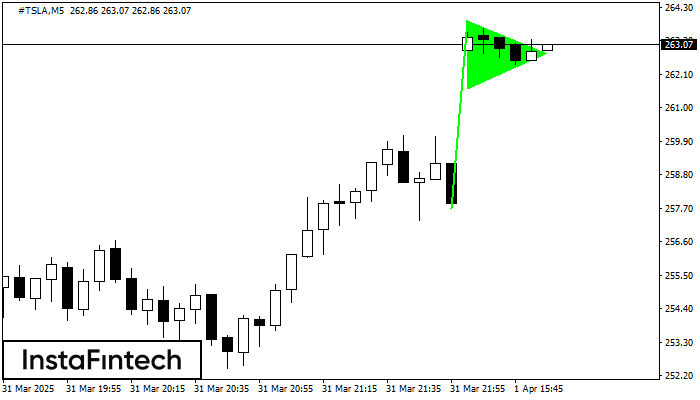
The Bullish pennant pattern is formed on the #TSLA M5 chart. It is a type of the continuation pattern. Supposedly, in case the price is fixed above the pennant’s high of 263.87, a further uptrend is possible.
The M5 and M15 time frames may have more false entry points.
Juga lihat
- All
- Double Top
- Flag
- Head and Shoulders
- Pennant
- Rectangle
- Triangle
- Triple top
- All
- #AAPL
- #AMZN
- #Bitcoin
- #EBAY
- #FB
- #GOOG
- #INTC
- #KO
- #MA
- #MCD
- #MSFT
- #NTDOY
- #PEP
- #TSLA
- #TWTR
- AUDCAD
- AUDCHF
- AUDJPY
- AUDUSD
- EURCAD
- EURCHF
- EURGBP
- EURJPY
- EURNZD
- EURRUB
- EURUSD
- GBPAUD
- GBPCHF
- GBPJPY
- GBPUSD
- GOLD
- NZDCAD
- NZDCHF
- NZDJPY
- NZDUSD
- SILVER
- USDCAD
- USDCHF
- USDJPY
- USDRUB
- All
- M5
- M15
- M30
- H1
- D1
- All
- Buy
- Sale
- All
- 1
- 2
- 3
- 4
- 5
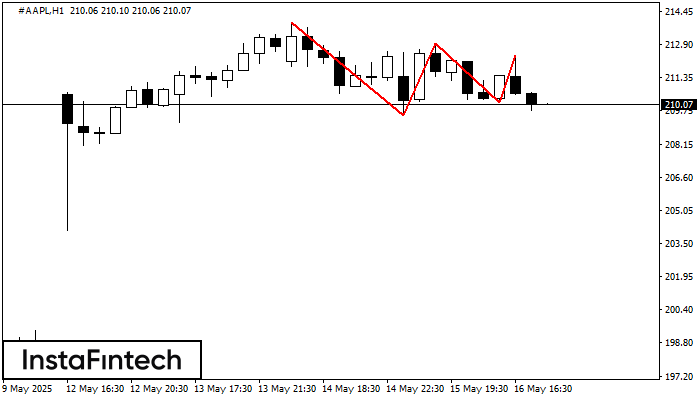
On the chart of the #AAPL H1 trading instrument, the Triple Top pattern that signals a trend change has formed. It is possible that after formation of the third peak
Open chart in a new window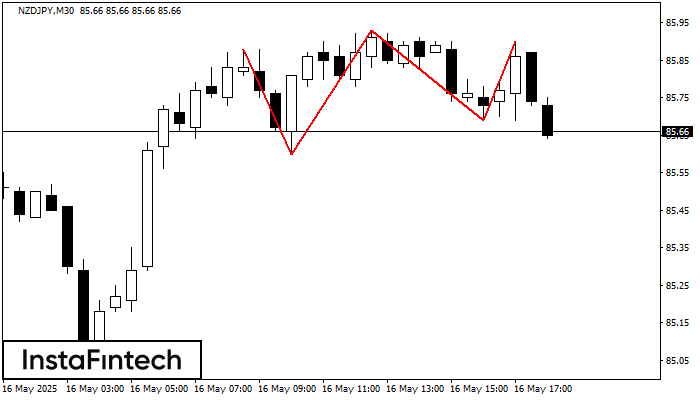
The Triple Top pattern has formed on the chart of the NZDJPY M30 trading instrument. It is a reversal pattern featuring the following characteristics: resistance level -2, support level -9
Open chart in a new window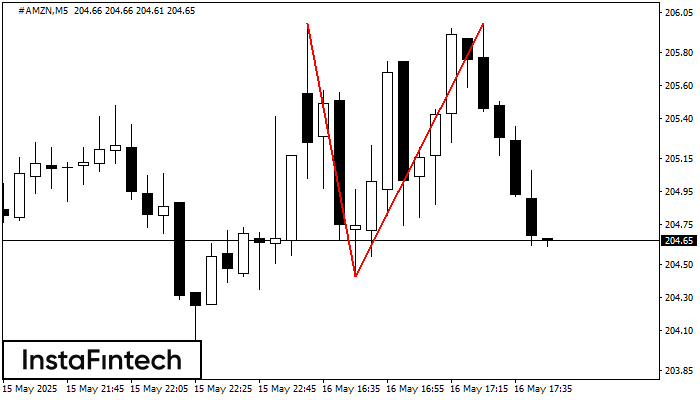
The Double Top pattern has been formed on #AMZN M5. It signals that the trend has been changed from upwards to downwards. Probably, if the base of the pattern 204.43
The M5 and M15 time frames may have more false entry points.
Open chart in a new window


