empty
22.08.2024 01:17 PM
GBP/USD. August 22. FOMC minutes confirm September rate cut

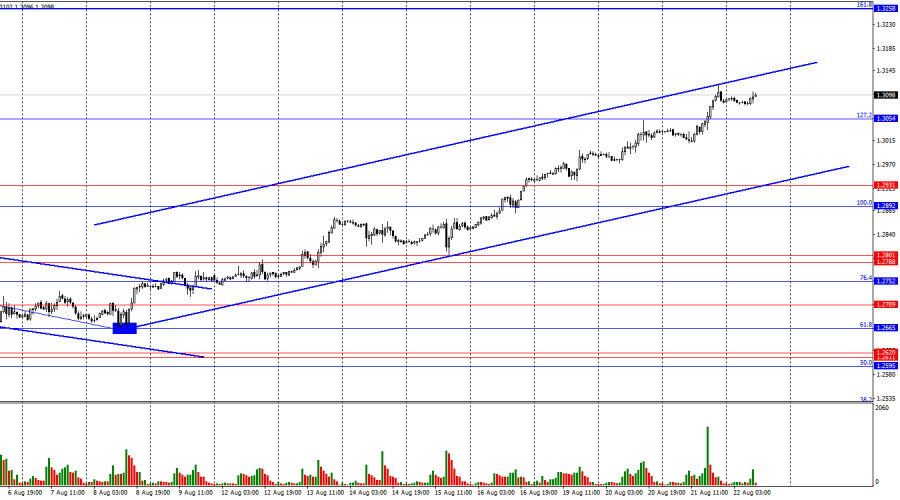
On the hourly chart, the GBP/USD pair continued its upward movement on Wednesday and consolidated above the 127.2% corrective level at 1.3054. This consolidation suggests that the pair may now continue to rise toward the next Fibonacci level of 161.8%, which is at 1.3258. A close below the 1.3054 level would indicate a potential decline toward the lower boundary of the upward trend channel, which still reflects a "bullish" sentiment among traders.

This image is no longer relevant

The wave pattern presents no major concerns. The last downward wave failed to break the previous low, while the subsequent upward wave only slightly surpassed the previous peak by a few points. Thus, we are currently dealing with a "bullish" trend, but the waves are so large that identifying a trend reversal would be significantly delayed. I simply don't see any internal waves that could serve as a reference for a trend break.

Wednesday's news coverage was quite extensive, yet it once again favored the bulls. The annual Nonfarm Payrolls report predictably came in worse than expected, and the FOMC minutes from the July 30-31 meeting confirmed that many committee members are seriously considering the need to start easing monetary policy. However, the minutes did not provide precise information. For example, they did not specify that a rate cut must happen in September, nor did they clarify how many FOMC members support or oppose a rate cut—information that is crucial for understanding what to expect from the U.S. regulator at the next meeting. Nevertheless, the market received two more signals indicating that the U.S. labor market is struggling and that the Fed is ready to start easing monetary policy. This contributed to a drop in the U.S. dollar.

This image is no longer relevant

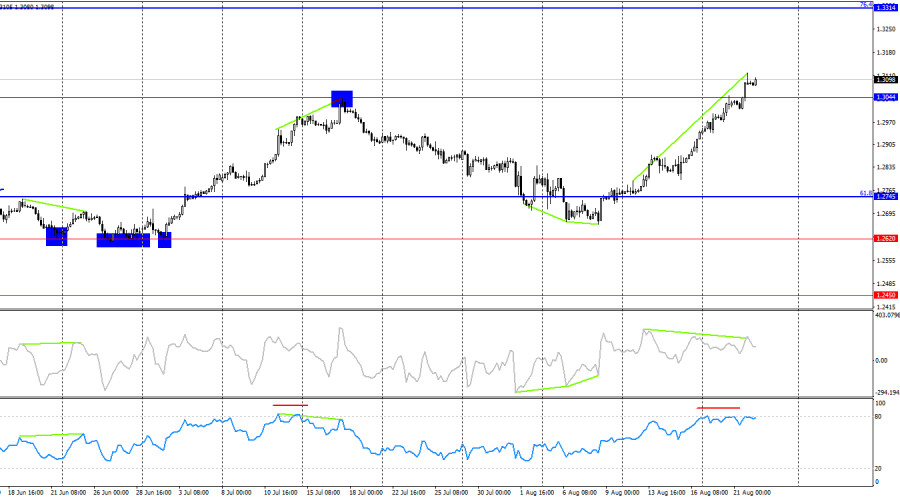
On the 4-hour chart, the pair consolidated above the 1.3044 level. The CCI indicator has been warning of a "bearish" divergence for a week now, and the RSI is in overbought territory, which is uncommon. Thus, I would say that the probability of the pair declining in the coming days is high. However, currently, the consolidation above the 1.3044 level suggests that the upward movement could continue toward the next Fibonacci level at 76.4%, which is at 1.3314.

Commitments of Traders (COT) Report:

This image is no longer relevant

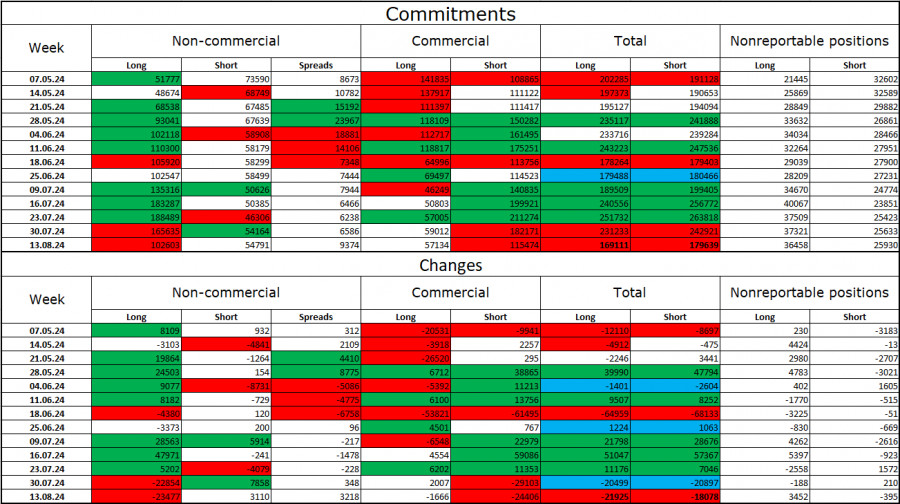
The sentiment among "Non-commercial" traders became significantly less "bullish" in the last reporting week. The number of long positions held by speculators decreased by 23,477, while the number of short positions increased by 3,110. Bulls still maintain a solid lead, with a difference of nearly 50,000 positions: 102,000 long versus 55,000 short.

In my opinion, there is still potential for the pound to decline, but the COT reports currently suggest otherwise. Over the past three months, the number of long positions has increased from 51,000 to 102,000, while the number of short positions has decreased from 74,000 to 55,000. I believe that, over time, professional players will start to reduce their long positions or increase their short positions, as all possible factors for buying the British pound have already been priced in. However, it's crucial to note that this is a speculative assumption. Technical analysis suggests a likely decline in the near future, but this doesn't necessarily mean that the decline will last several months or half a year.

News Calendar for the U.S. and the UK:

  • UK – Manufacturing PMI (08:30 UTC)
  • UK – Services PMI (08:30 UTC)
  • U.S. – Initial Jobless Claims (12:30 UTC)
  • U.S. – Manufacturing PMI (13:45 UTC)
  • U.S. – Services PMI (13:45 UTC)

The economic calendar on Thursday includes five key events, two of which have already supported the bulls. The impact of these events on market sentiment is expected to be moderate.

Forecast for GBP/USD and Trading Tips:

Selling the pair is possible today if it closes below 1.3054 on the hourly chart, targeting 1.2931. New buying opportunities were available yesterday when the pair closed above 1.3044, with a target of 1.3258.

Fibonacci grids are built from 1.2892 to 1.2298 on the hourly chart and from 1.4248 to 1.0404 on the 4-hour chart.

Pilih carta masa
5
min
15
min
30
min
1
jam
4
jam
1
hari
1
minggu
Jana pendapatan melalui perubahan kadar mata wang kripto dengan InstaForex.
Muat turun MetaTrader 4 dan buka dagangan pertama anda.
  • Grand Choice
    Contest by
    InstaForex
    InstaForex always strives to help you
    fulfill your biggest dreams.
    SERTAI PERADUAN

Artikel yang dicadangkan

EUR/USD. 12 Jun. Tekanan Terbaharu ke Atas Dolar

Selamat sejahtera, para pedagang yang dihormati! Pada hari Rabu, pasangan EUR/USD meneruskan pergerakan menaik setelah melantun semula dari zon sokongan 1.1374–1.1380. Ia berjaya disokong di atas tahap pemulihan semula Fibonacci

Samir Klishi 10:15 2025-06-12 UTC+2

GBP/USD. 12 Jun. Ekonomi Britain Melemah

Selamat sejahtera, para pedagang yang dihormati! Pada carta sejam, pada hari Rabu, pasangan GBP/USD telah berbalik memihak kepada pound Britain dan membuat pengukuhan di atas paras anjakan semula Fibonacci 161.8%

Samir Klishi 10:15 2025-06-12 UTC+2

Analisis Teknikal Pergerakan Harga Harian Instrumen Komoditi Minyak Mentah, Khamis 12 Jun 2025.

Jika kita melihat carta harian bagi instrumen komoditi Minyak Mentah, terdapat Perbezaan di antara pergerakan harga #CL dan penunjuk Pengayun Stochastic, yang menunjukkan kemungkinan #CL akan mengalami pembetulan penyusutan dalam

Arief Makmur 08:10 2025-06-12 UTC+2

Analisis Teknikal Pergerakan Harga Harian Indeks Nasdaq 100, Khamis 12 Jun 2025.

Pada carta 4 jam indeks Nasdaq 100, terdapat perbezaan antara pergerakan harga dan penunjuk Pengayun Stochastic, terutamanya dengan pengesahan pergerakan harga semasa #NDX yang bergerak di bawah EMA (21), maka

Arief Makmur 08:10 2025-06-12 UTC+2

Isyarat Dagangan untuk EUR/USD bagi 12-19 Jun, 2025: jual di bawah 1.1500 (21 SMA - 8/8 Murray)

Jika harga euro jatuh di bawah 1.1500 dalam beberapa jam akan datang, ini boleh dilihat sebagai peluang untuk menjual. Dari sudut teknikal, ia kelihatan terlebih belian pada carta

Dimitrios Zappas 05:33 2025-06-12 UTC+2

Isyarat Dagangan EMAS (XAU/USD) untuk 12-19 Jun 2025: jual di bawah $3,386 (21 SMA - 7/8 Murray)

Aliran XAU/USD kekal dalam fasa kenaikan selagi harga terus membuat pengukuhan di atas paras 3,331. Oleh demikian, adalah wajar untuk membeli emas selagi harga terus membuat pengukuhan di atas paras

Dimitrios Zappas 05:32 2025-06-12 UTC+2

Ramalan EUR/USD untuk 12 Jun 2025

Data inflasi A.S. yang dikeluarkan pada hari Rabu telah menggoyahkan pasaran: indeks dolar menurun sebanyak 0.47%, minyak WTI melonjak sebanyak 5.54%, emas meningkat sebanyak 1.27%, dan hasil Perbendaharaan A.S

Laurie Bailey 04:40 2025-06-12 UTC+2

Ramalan GBP/USD untuk 12 Jun 2025

Pada hari Rabu, pound British berjaya mengelakkan penurunan di bawah paras sokongan teknikal, lalu berbalik naik dari paras tersebut. Harga membuat lantunan dari garisan penunjuk MACD pada carta harian, manakala

Laurie Bailey 04:40 2025-06-12 UTC+2

Ramalan USD/JPY untuk 12 Jun 2025

Pembetulan harga sejak 27 Mei adalah kompleks dan berlarutan, sekali gus menimbulkan risiko penembusan melebihi paras 146.11. Namun, risiko ini kini tidak lagi menjadi kebimbangan berikutan pembalikan dari paras 145.08

Laurie Bailey 04:40 2025-06-12 UTC+2

Bitcoin: Kekuatan Dolar Boleh Mencetuskan Kejatuhan dalam Pasaran Kripto

Hari ini, tumpuan utama pasaran akan diberikan kepada penerbitan laporan inflasi Amerika Syarikat, yang dijangkakan bukan sahaja menunjukkan penghentian penurunan baru-baru ini, malah mencatatkan kenaikan inflasi tertinggi dalam tempoh empat

Pati Gani 11:47 2025-06-11 UTC+2
Tidak boleh bertanya sekarang?
Tanya soalan anda di Ruangan bersembang.
Panggilan semula Widget
 

Dear visitor,

Your IP address shows that you are currently located in the USA. If you are a resident of the United States, you are prohibited from using the services of InstaFintech Group including online trading, online transfers, deposit/withdrawal of funds, etc.

If you think you are seeing this message by mistake and your location is not the US, kindly proceed to the website. Otherwise, you must leave the website in order to comply with government restrictions.

Why does your IP address show your location as the USA?

  • - you are using a VPN provided by a hosting company based in the United States;
  • - your IP does not have proper WHOIS records;
  • - an error occurred in the WHOIS geolocation database.

Please confirm whether you are a US resident or not by clicking the relevant button below. If you choose the wrong option, being a US resident, you will not be able to open an account with InstaForex anyway.

We are sorry for any inconvenience caused by this message.