empty
21.08.2024 01:39 PM
EUR/USD. August 21st. An empty calendar does not confuse traders

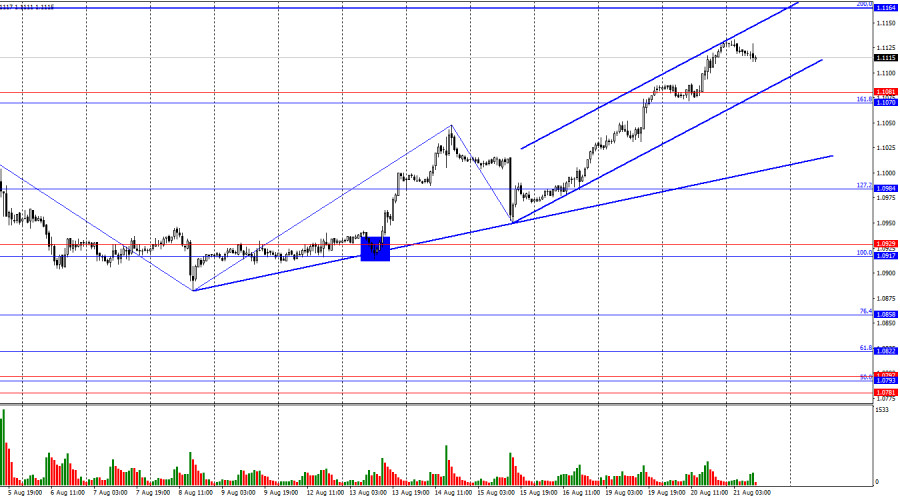
On Tuesday, the EUR/USD pair continued its upward movement after consolidating above the 1.1070–1.1081 zone. The upward movement in the pair's value continues on Wednesday within the upward trend channel, and the pair has a realistic chance of reaching the 200.0% corrective level at 1.1164 as early as today. The first signs of a retreat by the bulls will appear if the pair closes below the trend channel. The second sign will appear after a consolidation below the support zone of 1.1070–1.1081. However, even in this case, the growth of the U.S. dollar will be limited by the upward trendline.

This image is no longer relevant

The wave structure has become a bit more complicated, but it remains clear overall. The last completed downward wave did not break the low of the previous wave, while the new upward wave has broken the peak from August 14. Thus, the "bullish" trend is still intact. For the "bullish" trend to be nullified, the bears now need to break the low of the last downward wave, which is near the 1.0950 level.

The news background on Tuesday was extremely weak, but this did not deter the bullish traders. Throughout the day, we saw steady euro purchases once again. I maintain my opinion that bullish traders continue to drive the market based on expectations of an FOMC rate cut and Jerome Powell's speech at the Jackson Hole symposium at the end of the week. Whether this is truly the reason or not remains an open question. However, I see no other reasons for such a strong decline in the U.S. dollar. I also don't find it logical, as traders have been offloading the dollar almost every day. The Fed will undoubtedly cut rates in September, but no one knows what will happen next. If inflation accelerates again in August, September, or October, will the Fed cut rates in November and December? In my view, the market is once again too optimistic and is getting ahead of itself. There aren't enough factors right now to justify selling the dollar every day.

This image is no longer relevant

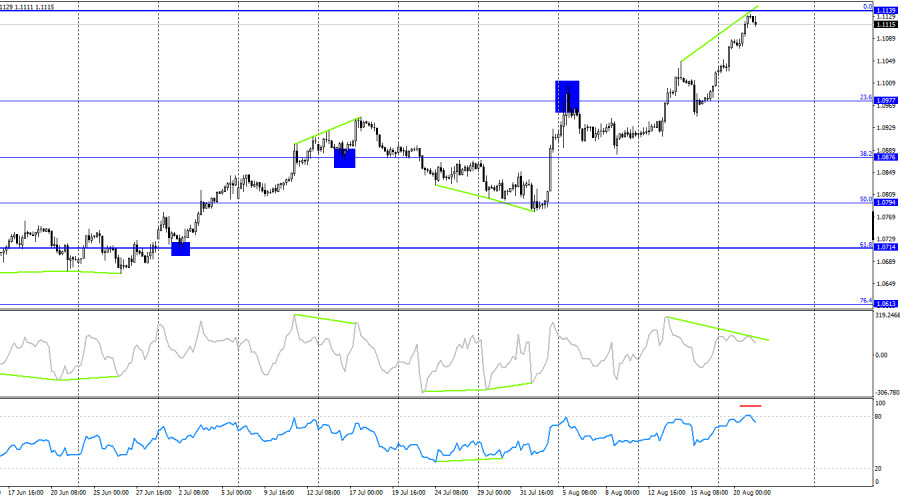
On the 4-hour chart, the pair has risen to the 0.0% Fibonacci level at 1.1139. A rebound from this level could signal a reversal in favor of the U.S. dollar and a potential decline towards the 23.6% corrective level at 1.0977. The CCI has been signaling a "bearish" divergence for several days, and the RSI is in overbought territory. Thus, there are many factors indicating a potential decline in the pair by the end of the week. However, is strong growth in the dollar likely at this time? In my opinion, no. Even if a downward trend begins, it will take quite some time to gather the necessary confirmations.

Commitments of Traders (COT) Report:

This image is no longer relevant

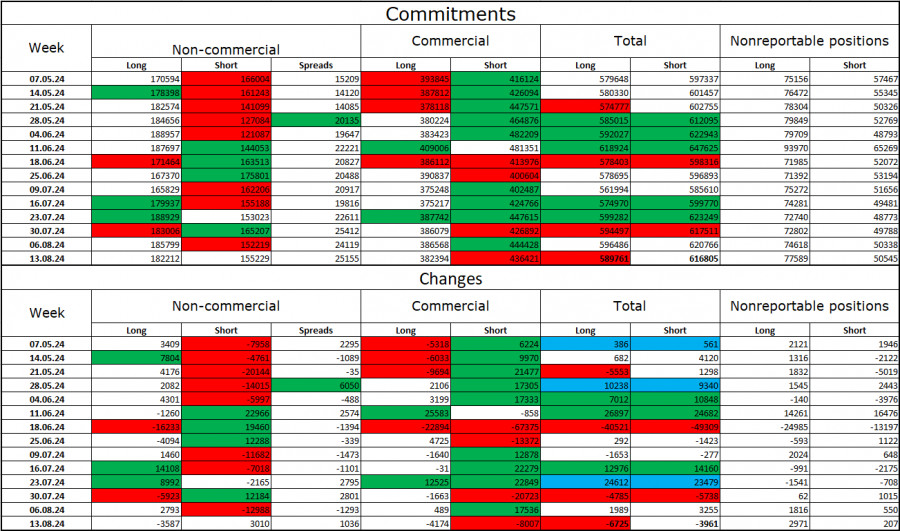
During the last reporting week, speculators closed 3,587 long positions and opened 3,010 short positions. The sentiment of the Non-commercial group turned bearish several months ago, but bulls are once again dominant. The total number of long positions held by speculators now stands at 182,000, while short positions total 155,000.

I still believe that the situation will continue to shift in favor of the bears. I don't see long-term reasons to buy the euro, as the ECB has begun easing monetary policy, which will lower the yields on bank deposits and government bonds. In the U.S., they will remain at high levels at least until September, making the dollar more attractive to investors. The potential for a decline in the euro appears significant. However, it is important to keep in mind the technical analysis, which currently does not strongly indicate a significant drop in the euro, as well as the news background, which consistently "throws a wrench" into the dollar's performance.

News Calendar for the U.S. and Eurozone:

U.S. – Release of FOMC Minutes (18:00 UTC).

On August 21, the economic calendar contains only one event. The influence of the news on trader sentiment today will be very weak.

Forecast for EUR/USD and Trading Advice:

Selling the pair today can be considered on a rebound from the 1.1139 level on the 4-hour chart with a target of 1.0977. Purchases were possible on a close above the 1.1080 level on the hourly chart with a target of 1.1140. This target is almost reached. I would approach new purchases with caution.

Fibonacci levels are plotted between 1.0917–1.0668 on the hourly chart and between 1.0450–1.1139 on the 4-hour chart.

Pilih carta masa
5
min
15
min
30
min
1
jam
4
jam
1
hari
1
minggu
Jana pendapatan melalui perubahan kadar mata wang kripto dengan InstaForex.
Muat turun MetaTrader 4 dan buka dagangan pertama anda.
  • Grand Choice
    Contest by
    InstaForex
    InstaForex always strives to help you
    fulfill your biggest dreams.
    SERTAI PERADUAN

Artikel yang dicadangkan

Ramalan untuk EUR/USD pada 10 Jun 2025

Pada hari Isnin, pasangan EUR/USD didagangkan secara mendatar antara paras 1.1380 dan 1.1454, membentuk satu julat. Oleh demikian, lantunan dari zon sokongan 1.1374–1.1380 akan memihak kepada euro dan menyokong pertumbuhan

Samir Klishi 10:33 2025-06-10 UTC+2

GBP/USD. 10 Jun. Pengangguran Meningkat di UK

Pada carta jam-jam, pasangan GBP/USD pada hari Isnin membuat dua lantunan dari tahap pembetulan 161.8% pada 1.3520 tetapi gagal untuk memulakan pergerakan menaik. Hari ini, pada hari Selasa, pasangan

Samir Klishi 10:21 2025-06-10 UTC+2

Analisis Teknikal Pergerakan Harga Intraday Pasangan Mata Wang Utama EUR/USD, Selasa 10 Jun 2025.

Dengan kemunculan corak Ascending Broadening Wedge yang diikuti oleh kemunculan corak Bearish 123, ini memberikan petunjuk bahawa dalam masa terdekat, pasangan EUR/USD berpotensi untuk melemah, terutamanya dengan pengesahan kemunculan perbezaan

Arief Makmur 05:59 2025-06-10 UTC+2

Analisis Teknikal Pergerakan Harga Harian bagi Pasangan Mata Wang Silang GBP/JPY, Selasa 10 Jun 2025.

Pada carta 4 jam pasangan mata wang silang GBP/JPY, terdapat beberapa perkara menarik yang dapat diperhatikan. Pertama, pergerakan harga bergerak di atas WMA (21) yang mempunyai cerun yang bergerak

Arief Makmur 05:59 2025-06-10 UTC+2

Ramalan untuk EUR/USD pada 10 Jun 2025

Hari Isnin berlalu dengan tenang di pasaran, dan perkara utama yang perlu diperhatikan adalah pemulihan korelasi berkaitan risiko. Euro kembali daripada sokongan garis MACD harian untuk hari kedua berturut-turut

Laurie Bailey 04:52 2025-06-10 UTC+2

Ramalan untuk GBP/USD pada 10 Jun, 2025

Pada hari Isnin, pound British ditutup dengan kenaikan kecil. Corak ini telah menjadi kebiasaan sepanjang minggu lalu — kenaikan dicirikan oleh lilin putih kecil, manakala penurunan berlaku melalui lilin hitam

Laurie Bailey 04:48 2025-06-10 UTC+2

Ramalan AUD/USD untuk 10 Jun 2025

Dolar Australia telah menunjukkan pertumbuhan yang sederhana melebihi satu angka dalam tempoh 10 hari yang lalu, tetapi keengganan pengayun Marlin untuk mengikuti pergerakan menaik ini menimbulkan kebimbangan dalam kalangan pasaran

Laurie Bailey 04:46 2025-06-10 UTC+2

Isyarat Dagangan untuk EMAS (XAU/USD) bagi 9-12 Jun 2025: jual di bawah $3,350 (21 SMA - 7/8 Murray)

Awal sesi Amerika, emas didagangkan sekitar 3,317, melantun selepas mencapai paras rendah 3,294 semasa sesi Eropah. Pada carta H4, emas boleh terus meningkat dan boleh mencapai 21SMA yang terletak sekitar

Dimitrios Zappas 15:23 2025-06-09 UTC+2

Isyarat Dagangan EUR/USD untuk 9-12 Jun 2025: jual di bawah 1.1415 (21 SMA - 6/8 Murray)

Kami percaya euro boleh terus melemah memandangkan satu corak kesinambungan menurun sedang terbentuk, namun kita harus menjangkakan ia menembusi di bawah paras 1.1400, yang kemudiannya boleh mencapai dasar saluran arah

Dimitrios Zappas 15:20 2025-06-09 UTC+2

EUR/USD. Analisis dan Ramalan

Hari ini, pasangan EUR/USD menarik minat pembeli, memulihkan sebahagian kerugian pada hari Jumaat di tengah kelemahan dolar AS. Dari sudut pandangan teknikal, pasangan EUR/USD kini menunjukkan ketahanan di bawah Purata

Irina Yanina 13:57 2025-06-09 UTC+2
Tidak boleh bertanya sekarang?
Tanya soalan anda di Ruangan bersembang.
Panggilan semula Widget
 

Dear visitor,

Your IP address shows that you are currently located in the USA. If you are a resident of the United States, you are prohibited from using the services of InstaFintech Group including online trading, online transfers, deposit/withdrawal of funds, etc.

If you think you are seeing this message by mistake and your location is not the US, kindly proceed to the website. Otherwise, you must leave the website in order to comply with government restrictions.

Why does your IP address show your location as the USA?

  • - you are using a VPN provided by a hosting company based in the United States;
  • - your IP does not have proper WHOIS records;
  • - an error occurred in the WHOIS geolocation database.

Please confirm whether you are a US resident or not by clicking the relevant button below. If you choose the wrong option, being a US resident, you will not be able to open an account with InstaForex anyway.

We are sorry for any inconvenience caused by this message.