


signal strength 1 of 5
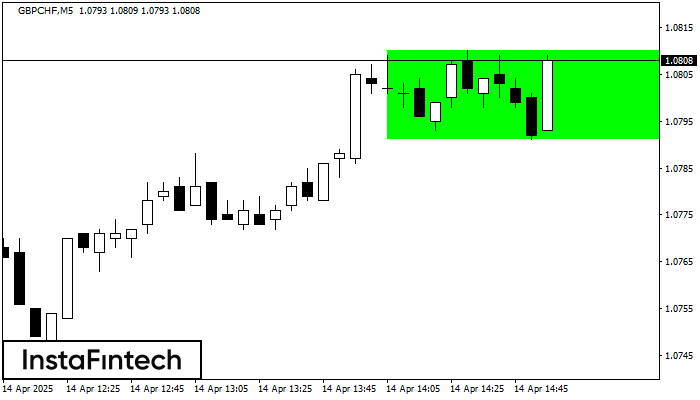
According to the chart of M5, GBPCHF formed the Bullish Rectangle. The pattern indicates a trend continuation. The upper border is 1.0810, the lower border is 1.0791. The signal means that a long position should be opened above the upper border 1.0810 of the Bullish Rectangle.
The M5 and M15 time frames may have more false entry points.
- All
- Double Top
- Flag
- Head and Shoulders
- Pennant
- Rectangle
- Triangle
- Triple top
- All
- #AAPL
- #AMZN
- #Bitcoin
- #EBAY
- #FB
- #GOOG
- #INTC
- #KO
- #MA
- #MCD
- #MSFT
- #NTDOY
- #PEP
- #TSLA
- #TWTR
- AUDCAD
- AUDCHF
- AUDJPY
- AUDUSD
- EURCAD
- EURCHF
- EURGBP
- EURJPY
- EURNZD
- EURRUB
- EURUSD
- GBPAUD
- GBPCHF
- GBPJPY
- GBPUSD
- GOLD
- NZDCAD
- NZDCHF
- NZDJPY
- NZDUSD
- SILVER
- USDCAD
- USDCHF
- USDJPY
- USDRUB
- All
- M5
- M15
- M30
- H1
- D1
- All
- Buy
- Sale
- All
- 1
- 2
- 3
- 4
- 5
was formed on 09.05 at 01:00:28 (UTC+0)
signal strength 4 of 5
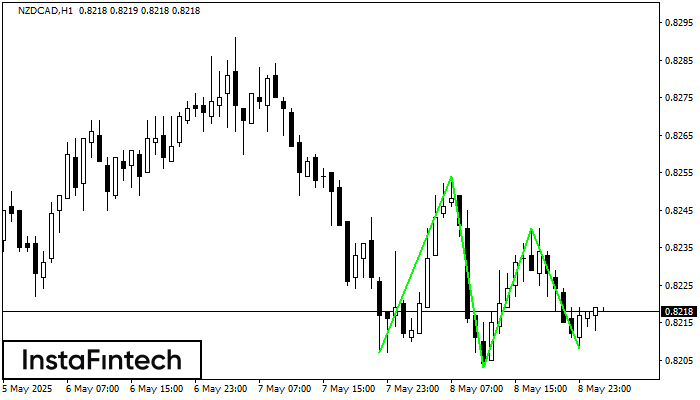
รูปแบบ รูปแบบกราฟจุดสามยอดขาลง (Triple Bottom) ได้สร้างขึ้นมาในชาร์ตของ NZDCAD H1 ลักษณะของกราฟรูปแบบนี้: เส้นด้านล่างของกราฟรูปแบบนี้มีพิกัดอยู่ที่ 0.8254 พร้อมกับลิมิตด้านบน 0.8254/0.8240,ระยะของความกว้างคือ 47 จุด การก่อตัวของกราฟรูปแบบ
Open chart in a new window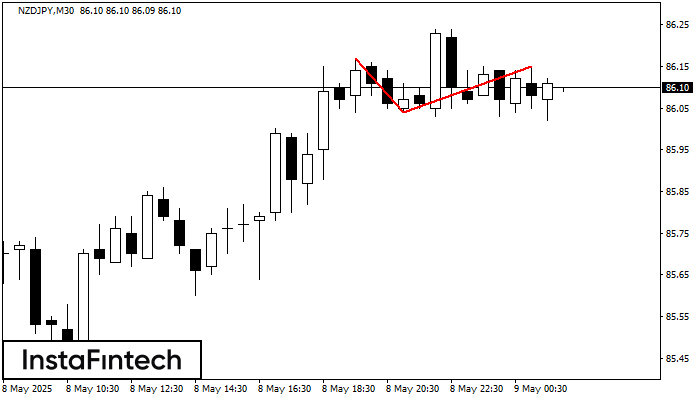
รูปแบบการย้อนตัว รูปแบบกราฟจุดสองยอด (Double Top) ได้ถูกสร้างขึ้นมาใน NZDJPY M30 คุณลักษณะ: ขอบเขตด้านบน 86.17; ขอบเขตด้านล่าง 86.04; ความกว้างของกราฟรูปแบบนี้คือ 11 จุด
Open chart in a new windowwas formed on 09.05 at 00:46:04 (UTC+0)
signal strength 1 of 5
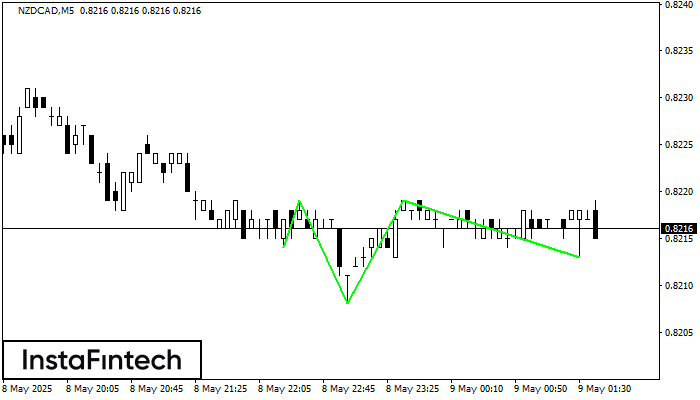
อ้างอิงจากชาร์ตของ M5, NZDCAD ที่ได้สร้างรูปแบบ รูปแบบกราฟหัวและหัวไหล่แบบกลับหัว (Inverse Head and Shoulder) ออกมา ระดับสูงสุดของตำแหน่งหัวอยู่ที่ 0.8219 ในขณะที่เส้นระดับกลางของแนวคอ จะอยู่ที่ 0.8208/0.8213
ขอบเตระยะเวลาใน M5 และ M15 อาจจะมีตำแหน่งการเข้าใช้งานที่ผิดพลาดมากยิ่งขึ้น
Open chart in a new window


