empty
was formed on 25.03 at 19:15:33 (UTC+0)
signal strength 2 of 5
Double Bottom #INTC M15

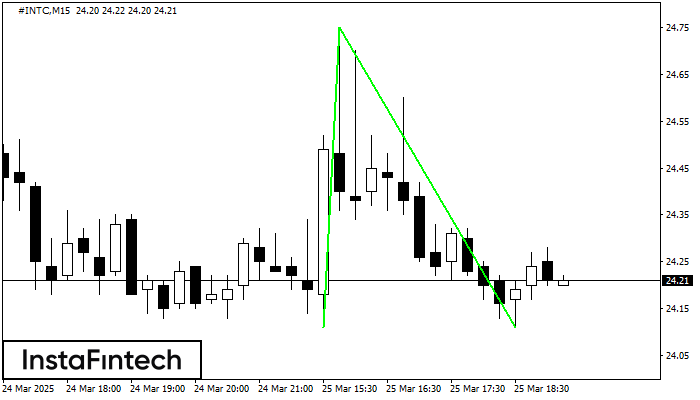
The Double Bottom pattern has been formed on #INTC M15; the upper boundary is 24.75; the lower boundary is 24.11. The width of the pattern is 64 points. In case of a break of the upper boundary 24.75, a change in the trend can be predicted where the width of the pattern will coincide with the distance to a possible take profit level.

The M5 and M15 time frames may have more false entry points.

Figure
  • All
  • Double Top
  • Flag
  • Head and Shoulders
  • Pennant
  • Rectangle
  • Triangle
  • Triple top
Instrument
  • All
  • #AAPL
  • #AMZN
  • #Bitcoin
  • #EBAY
  • #FB
  • #GOOG
  • #INTC
  • #KO
  • #MA
  • #MCD
  • #MSFT
  • #NTDOY
  • #PEP
  • #TSLA
  • #TWTR
  • AUDCAD
  • AUDCHF
  • AUDJPY
  • AUDUSD
  • EURCAD
  • EURCHF
  • EURGBP
  • EURJPY
  • EURNZD
  • EURRUB
  • EURUSD
  • GBPAUD
  • GBPCHF
  • GBPJPY
  • GBPUSD
  • GOLD
  • NZDCAD
  • NZDCHF
  • NZDJPY
  • NZDUSD
  • SILVER
  • USDCAD
  • USDCHF
  • USDJPY
  • USDRUB
Timeframe
  • All
  • M5
  • M15
  • M30
  • H1
  • D1
Trend
  • All
  • Buy
  • Sale
Signal Strength
  • All
  • 1
  • 2
  • 3
  • 4
  • 5
Bearish Rectangle
was formed on 27.03 at 07:21:11 (UTC+0)
signal strength 1 of 5
Bearish Rectangle GBPAUD M5

According to the chart of M5, GBPAUD formed the Bearish Rectangle. This type of a pattern indicates a trend continuation. It consists of two levels: resistance 2.0468 - 0.0000

The M5 and M15 time frames may have more false entry points.

Open chart in a new window
Triple Bottom
was formed on 27.03 at 06:40:25 (UTC+0)
signal strength 1 of 5
Triple Bottom USDJPY M5

The Triple Bottom pattern has formed on the chart of USDJPY M5. Features of the pattern: The lower line of the pattern has coordinates 150.29 with the upper limit 150.29/150.27

The M5 and M15 time frames may have more false entry points.

Open chart in a new window
Inverse Head and Shoulder
was formed on 27.03 at 06:15:12 (UTC+0)
signal strength 2 of 5
Inverse Head and Shoulder GBPCHF M15

According to M15, GBPCHF is shaping the technical pattern – the Inverse Head and Shoulder. In case the Neckline 1.1398/1.1397 is broken out, the instrument is likely to move toward

The M5 and M15 time frames may have more false entry points.

Open chart in a new window
Bearish Rectangle
was formed on 27.03 at 06:07:54 (UTC+0)
signal strength 1 of 5
Bearish Rectangle USDJPY M5

According to the chart of M5, USDJPY formed the Bearish Rectangle. The pattern indicates a trend continuation. The upper border is 150.29, the lower border is 150.10. The signal means

The M5 and M15 time frames may have more false entry points.

Open chart in a new window
Double Top
was formed on 27.03 at 05:23:08 (UTC+0)
signal strength 1 of 5
Double Top SILVER M5

The Double Top reversal pattern has been formed on SILVER M5. Characteristics: the upper boundary 33.67; the lower boundary 33.66; the width of the pattern is 20 points. Sell trades

The M5 and M15 time frames may have more false entry points.

Open chart in a new window
Double Top
was formed on 27.03 at 04:55:37 (UTC+0)
signal strength 1 of 5
Double Top SILVER M5

On the chart of SILVER M5 the Double Top reversal pattern has been formed. Characteristics: the upper boundary 33.67; the lower boundary 33.56; the width of the pattern 110 points

The M5 and M15 time frames may have more false entry points.

Open chart in a new window
Double Top
was formed on 27.03 at 04:40:34 (UTC+0)
signal strength 1 of 5
Double Top GBPJPY M5

On the chart of GBPJPY M5 the Double Top reversal pattern has been formed. Characteristics: the upper boundary 193.99; the lower boundary 193.52; the width of the pattern 47 points

The M5 and M15 time frames may have more false entry points.

Open chart in a new window
Triple Top
was formed on 27.03 at 04:30:09 (UTC+0)
signal strength 2 of 5
Triple Top GBPAUD M15

On the chart of the GBPAUD M15 trading instrument, the Triple Top pattern that signals a trend change has formed. It is possible that after formation of the third peak

The M5 and M15 time frames may have more false entry points.

Open chart in a new window
Bearish Symmetrical Triangle
was formed on 27.03 at 03:36:21 (UTC+0)
signal strength 1 of 5
Bearish Symmetrical Triangle NZDCAD M5

According to the chart of M5, NZDCAD formed the Bearish Symmetrical Triangle pattern. This pattern signals a further downward trend in case the lower border 0.8165 is breached. Here

The M5 and M15 time frames may have more false entry points.

Open chart in a new window
अभी बात नहीं कर सकते?
अपना प्रश्न पूछें बातचीत.
Widget callback
 

Dear visitor,

Your IP address shows that you are currently located in the USA. If you are a resident of the United States, you are prohibited from using the services of InstaFintech Group including online trading, online transfers, deposit/withdrawal of funds, etc.

If you think you are seeing this message by mistake and your location is not the US, kindly proceed to the website. Otherwise, you must leave the website in order to comply with government restrictions.

Why does your IP address show your location as the USA?

  • - you are using a VPN provided by a hosting company based in the United States;
  • - your IP does not have proper WHOIS records;
  • - an error occurred in the WHOIS geolocation database.

Please confirm whether you are a US resident or not by clicking the relevant button below. If you choose the wrong option, being a US resident, you will not be able to open an account with InstaForex anyway.

We are sorry for any inconvenience caused by this message.