


signal strength 2 of 5
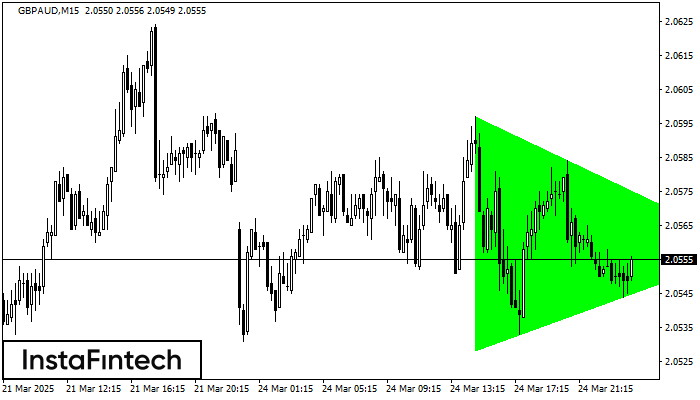
According to the chart of M15, GBPAUD formed the Bullish Symmetrical Triangle pattern. Description: This is the pattern of a trend continuation. 2.0597 and 2.0528 are the coordinates of the upper and lower borders respectively. The pattern width is measured on the chart at 69 pips. Outlook: If the upper border 2.0597 is broken, the price is likely to continue its move by 2.0580.
The M5 and M15 time frames may have more false entry points.
See Also
- All
- Double Top
- Flag
- Head and Shoulders
- Pennant
- Rectangle
- Triangle
- Triple top
- All
- #AAPL
- #AMZN
- #Bitcoin
- #EBAY
- #FB
- #GOOG
- #INTC
- #KO
- #MA
- #MCD
- #MSFT
- #NTDOY
- #PEP
- #TSLA
- #TWTR
- AUDCAD
- AUDCHF
- AUDJPY
- AUDUSD
- EURCAD
- EURCHF
- EURGBP
- EURJPY
- EURNZD
- EURRUB
- EURUSD
- GBPAUD
- GBPCHF
- GBPJPY
- GBPUSD
- GOLD
- NZDCAD
- NZDCHF
- NZDJPY
- NZDUSD
- SILVER
- USDCAD
- USDCHF
- USDJPY
- USDRUB
- All
- M5
- M15
- M30
- H1
- D1
- All
- Buy
- Sale
- All
- 1
- 2
- 3
- 4
- 5

According to the chart of M30, AUDCHF produced the pattern termed the Inverse Head and Shoulder. The Head is fixed at 0.5043 while the median line of the Neck
Open chart in a new window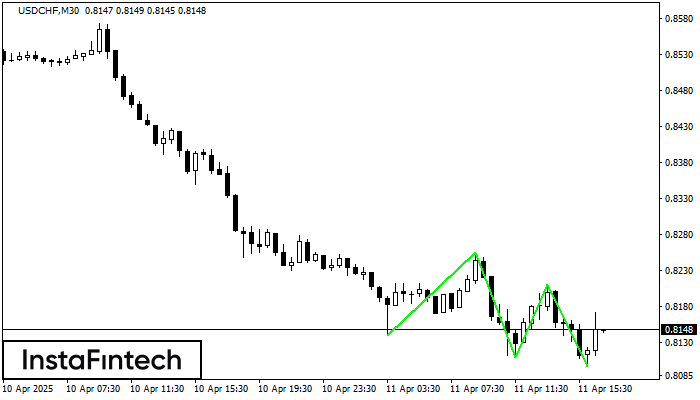
The Triple Bottom pattern has formed on the chart of the USDCHF M30 trading instrument. The pattern signals a change in the trend from downwards to upwards in the case
Open chart in a new window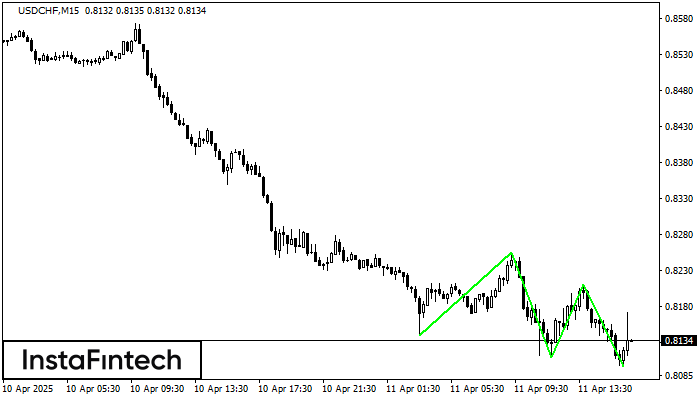
The Triple Bottom pattern has formed on the chart of the USDCHF M15 trading instrument. The pattern signals a change in the trend from downwards to upwards in the case
The M5 and M15 time frames may have more false entry points.
Open chart in a new window


